

654
S. P. Singh and S. Siddhanta
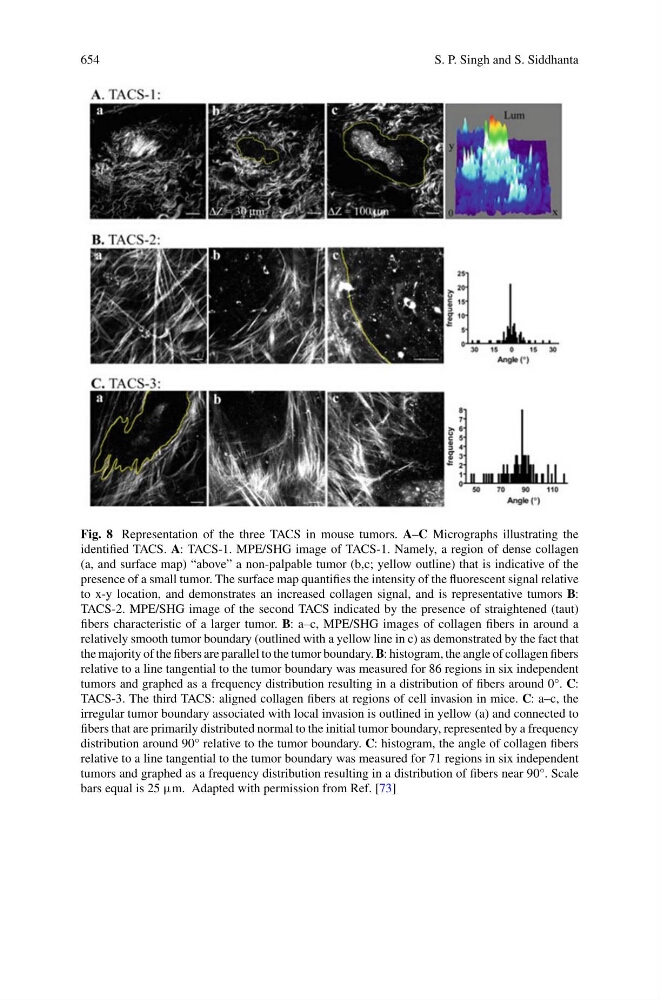
Fig. 8 Representation of the three TACS in mouse tumors. A–C Micrographs illustrating the
identified TACS. A: TACS-1. MPE/SHG image of TACS-1. Namely, a region of dense collagen
(a, and surface map) “above” a non-palpable tumor (b,c; yellow outline) that is indicative of the
presence of a small tumor. The surface map quantifies the intensity of the fluorescent signal relative
to x-y location, and demonstrates an increased collagen signal, and is representative tumors B:
TACS-2. MPE/SHG image of the second TACS indicated by the presence of straightened (taut)
fibers characteristic of a larger tumor. B: a–c, MPE/SHG images of collagen fibers in around a
relatively smooth tumor boundary (outlined with a yellow line in c) as demonstrated by the fact that
the majority of the fibers are parallel to the tumor boundary. B: histogram, the angle of collagen fibers
relative to a line tangential to the tumor boundary was measured for 86 regions in six independent
tumors and graphed as a frequency distribution resulting in a distribution of fibers around 0°. C:
TACS-3. The third TACS: aligned collagen fibers at regions of cell invasion in mice. C: a–c, the
irregular tumor boundary associated with local invasion is outlined in yellow (a) and connected to
fibers that are primarily distributed normal to the initial tumor boundary, represented by a frequency
distribution around 90° relative to the tumor boundary. C: histogram, the angle of collagen fibers
relative to a line tangential to the tumor boundary was measured for 71 regions in six independent
tumors and graphed as a frequency distribution resulting in a distribution of fibers near 90°. Scale
bars equal is 25 μm. Adapted with permission from Ref. [73]