

642
S. P. Singh and S. Siddhanta
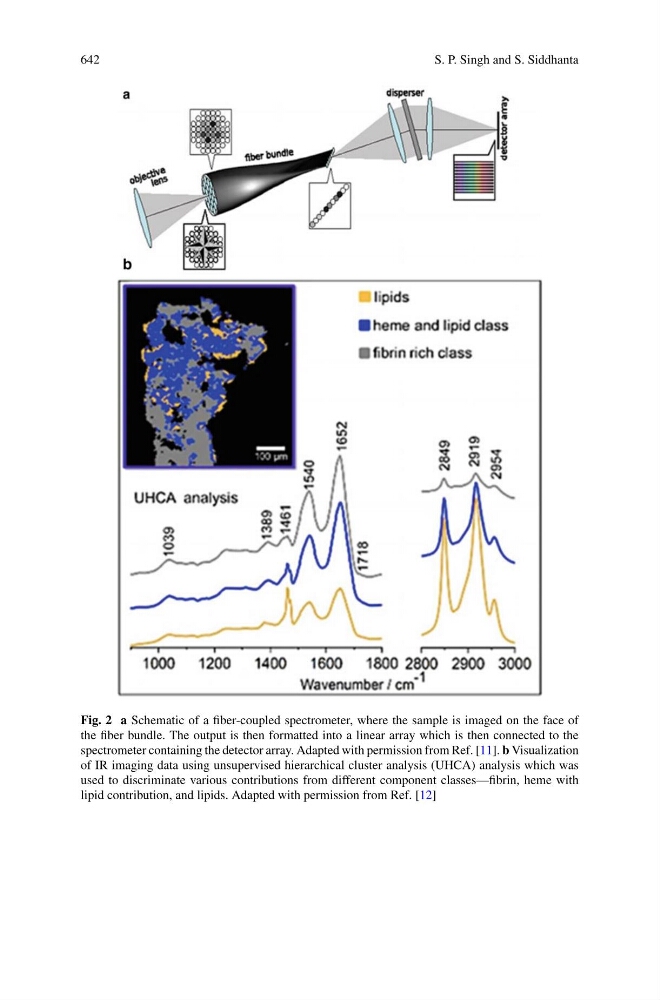
Fig. 2 a Schematic of a fiber-coupled spectrometer, where the sample is imaged on the face of
the fiber bundle. The output is then formatted into a linear array which is then connected to the
spectrometer containing the detector array. Adapted with permission from Ref. [11]. b Visualization
of IR imaging data using unsupervised hierarchical cluster analysis (UHCA) analysis which was
used to discriminate various contributions from different component classes—fibrin, heme with
lipid contribution, and lipids. Adapted with permission from Ref. [12]