

Two Dimensional Infrared Spectroscopy …
49
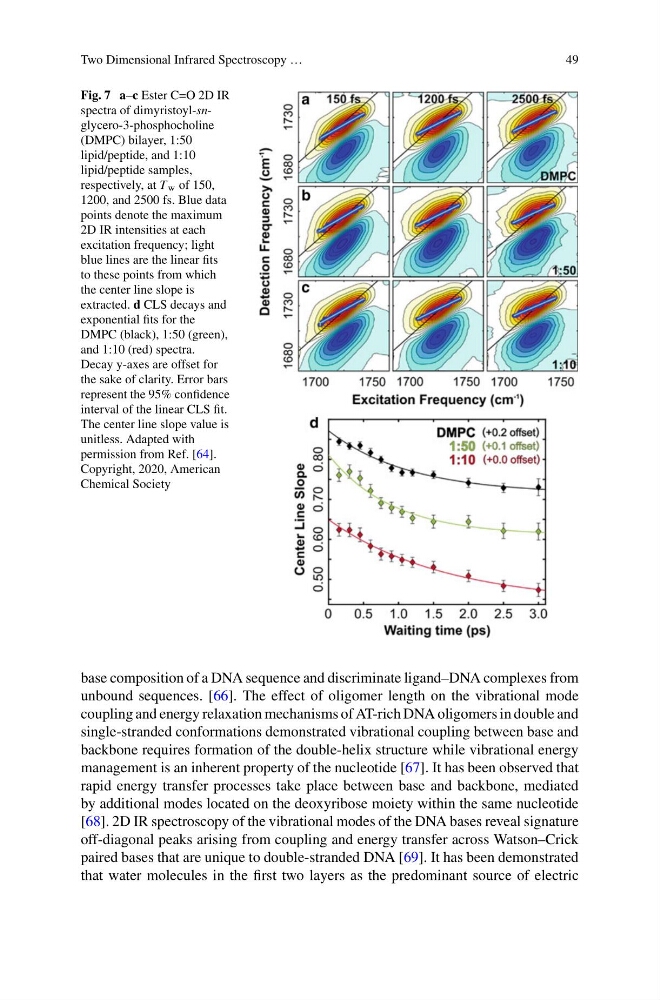
Fig. 7 a–c Ester C=O 2D IR
spectra of dimyristoyl-snglycero-3-phosphocholine
(DMPC) bilayer, 1:50
lipid/peptide, and 1:10
lipid/peptide samples,
respectively, at T w of 150,
1200, and 2500 fs. Blue data
points denote the maximum
2D IR intensities at each
excitation frequency; light
blue lines are the linear fits
to these points from which
the center line slope is
extracted. d CLS decays and
exponential fits for the
DMPC (black), 1:50 (green),
and 1:10 (red) spectra.
Decay y-axes are offset for
the sake of clarity. Error bars
represent the 95% confidence
interval of the linear CLS fit.
The center line slope value is
unitless. Adapted with
permission from Ref. [64].
Copyright, 2020, American
Chemical Society
base composition of a DNA sequence and discriminate ligand–DNA complexes from
unbound sequences. [66]. The effect of oligomer length on the vibrational mode
coupling and energy relaxation mechanisms of AT-rich DNA oligomers in double and
single-stranded conformations demonstrated vibrational coupling between base and
backbone requires formation of the double-helix structure while vibrational energy
management is an inherent property of the nucleotide [67]. It has been observed that
rapid energy transfer processes take place between base and backbone, mediated
by additional modes located on the deoxyribose moiety within the same nucleotide
[68]. 2D IR spectroscopy of the vibrational modes of the DNA bases reveal signature
off-diagonal peaks arising from coupling and energy transfer across Watson–Crick
paired bases that are unique to double-stranded DNA [69]. It has been demonstrated
that water molecules in the first two layers as the predominant source of electric
49
Fig. 7 a–c Ester C=O 2D IR
spectra of dimyristoyl-snglycero-3-phosphocholine
(DMPC) bilayer, 1:50
lipid/peptide, and 1:10
lipid/peptide samples,
respectively, at T w of 150,
1200, and 2500 fs. Blue data
points denote the maximum
2D IR intensities at each
excitation frequency; light
blue lines are the linear fits
to these points from which
the center line slope is
extracted. d CLS decays and
exponential fits for the
DMPC (black), 1:50 (green),
and 1:10 (red) spectra.
Decay y-axes are offset for
the sake of clarity. Error bars
represent the 95% confidence
interval of the linear CLS fit.
The center line slope value is
unitless. Adapted with
permission from Ref. [64].
Copyright, 2020, American
Chemical Society
base composition of a DNA sequence and discriminate ligand–DNA complexes from
unbound sequences. [66]. The effect of oligomer length on the vibrational mode
coupling and energy relaxation mechanisms of AT-rich DNA oligomers in double and
single-stranded conformations demonstrated vibrational coupling between base and
backbone requires formation of the double-helix structure while vibrational energy
management is an inherent property of the nucleotide [67]. It has been observed that
rapid energy transfer processes take place between base and backbone, mediated
by additional modes located on the deoxyribose moiety within the same nucleotide
[68]. 2D IR spectroscopy of the vibrational modes of the DNA bases reveal signature
off-diagonal peaks arising from coupling and energy transfer across Watson–Crick
paired bases that are unique to double-stranded DNA [69]. It has been demonstrated
that water molecules in the first two layers as the predominant source of electric