

Surface Photo-Voltage Spectroscopy: A Versatile Technique …
621
where ω is 2π times the chopper frequency and A is a proportionality constant. The
physical mechanisms responsible for frequency dependence of the SPV signal [77]
can be given as (a) different capture and emission cross-sections of sub-bandgap
states, (b) non-stationary charge distributions in SCR1 or SCR2, and/or (c) Dember
effect from the RC time constant, which is inherent to the SPS measurements [67].
Thus, the τ here is a characteristic time constant related to charge dynamics. It should
not be confused with the minority carrier lifetime.
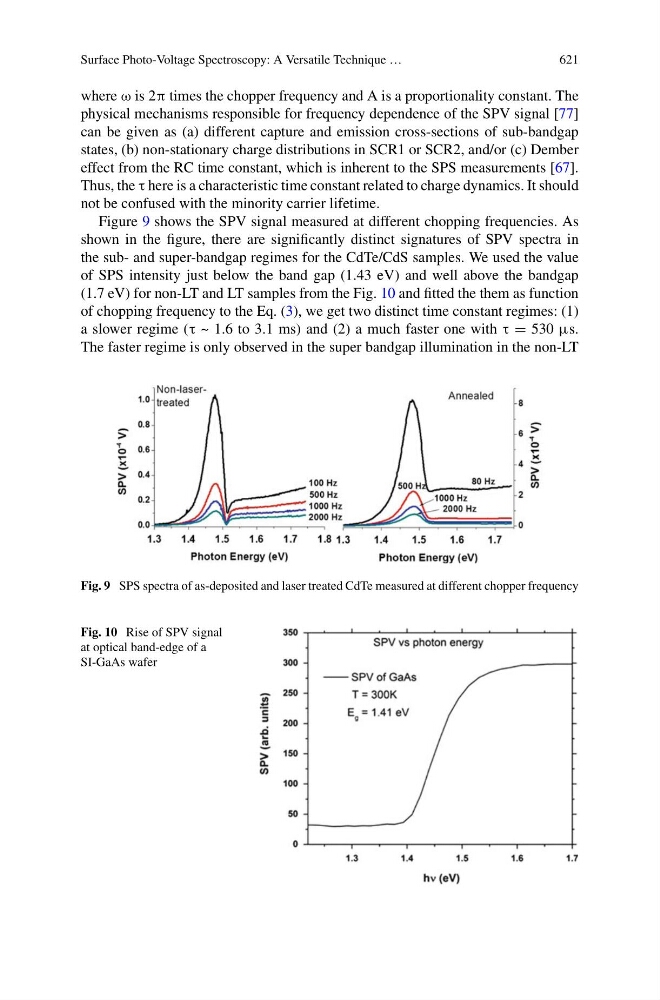
Figure 9 shows the SPV signal measured at different chopping frequencies. As
shown in the figure, there are significantly distinct signatures of SPV spectra in
the sub- and super-bandgap regimes for the CdTe/CdS samples. We used the value
of SPS intensity just below the band gap (1.43 eV) and well above the bandgap
(1.7 eV) for non-LT and LT samples from the Fig. 10 and fitted the them as function
of chopping frequency to the Eq. (3), we get two distinct time constant regimes: (1)
a slower regime (τ ~ 1.6 to 3.1 ms) and (2) a much faster one with τ = 530 μs.
The faster regime is only observed in the super bandgap illumination in the non-LT
Fig. 9 SPS spectra of as-deposited and laser treated CdTe measured at different chopper frequency
Fig. 10 Rise of SPV signal
at optical band-edge of a
SI-GaAs wafer