

Surface Photo-Voltage Spectroscopy: A Versatile Technique …
619
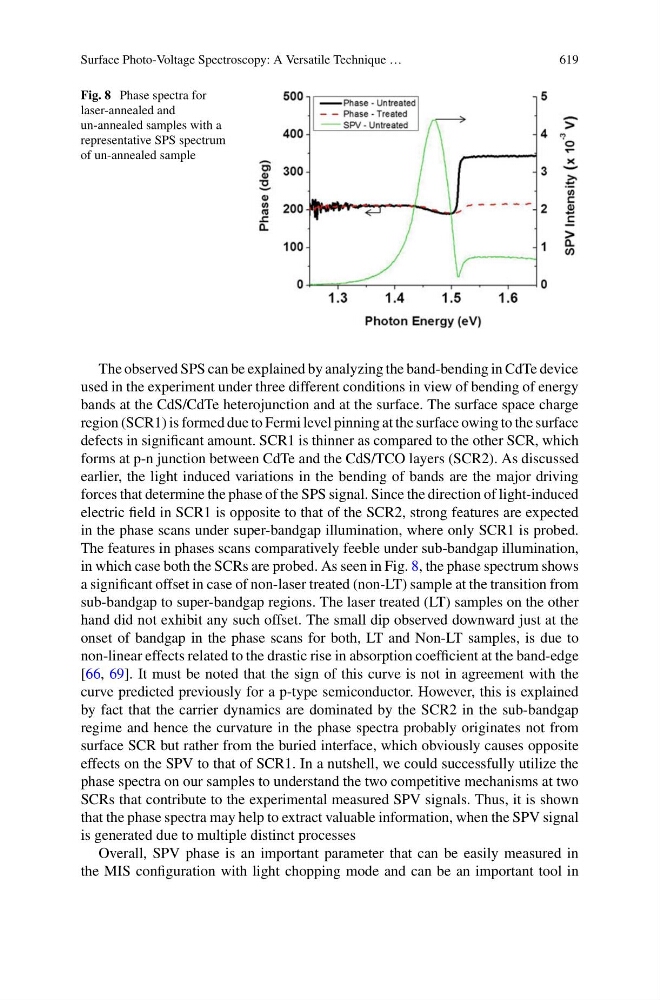
Fig. 8 Phase spectra for
laser-annealed and
un-annealed samples with a
representative SPS spectrum
of un-annealed sample
The observed SPS can be explained by analyzing the band-bending in CdTe device
used in the experiment under three different conditions in view of bending of energy
bands at the CdS/CdTe heterojunction and at the surface. The surface space charge
region (SCR1) is formed due to Fermi level pinning at the surface owing to the surface
defects in significant amount. SCR1 is thinner as compared to the other SCR, which
forms at p-n junction between CdTe and the CdS/TCO layers (SCR2). As discussed
earlier, the light induced variations in the bending of bands are the major driving
forces that determine the phase of the SPS signal. Since the direction of light-induced
electric field in SCR1 is opposite to that of the SCR2, strong features are expected
in the phase scans under super-bandgap illumination, where only SCR1 is probed.
The features in phases scans comparatively feeble under sub-bandgap illumination,
in which case both the SCRs are probed. As seen in Fig. 8, the phase spectrum shows
a significant offset in case of non-laser treated (non-LT) sample at the transition from
sub-bandgap to super-bandgap regions. The laser treated (LT) samples on the other
hand did not exhibit any such offset. The small dip observed downward just at the
onset of bandgap in the phase scans for both, LT and Non-LT samples, is due to
non-linear effects related to the drastic rise in absorption coefficient at the band-edge
[66, 69]. It must be noted that the sign of this curve is not in agreement with the
curve predicted previously for a p-type semiconductor. However, this is explained
by fact that the carrier dynamics are dominated by the SCR2 in the sub-bandgap
regime and hence the curvature in the phase spectra probably originates not from
surface SCR but rather from the buried interface, which obviously causes opposite
effects on the SPV to that of SCR1. In a nutshell, we could successfully utilize the
phase spectra on our samples to understand the two competitive mechanisms at two
SCRs that contribute to the experimental measured SPV signals. Thus, it is shown
that the phase spectra may help to extract valuable information, when the SPV signal
is generated due to multiple distinct processes
Overall, SPV phase is an important parameter that can be easily measured in
the MIS configuration with light chopping mode and can be an important tool in