

Two Dimensional Infrared Spectroscopy …
45
4 2D IR Spectrum
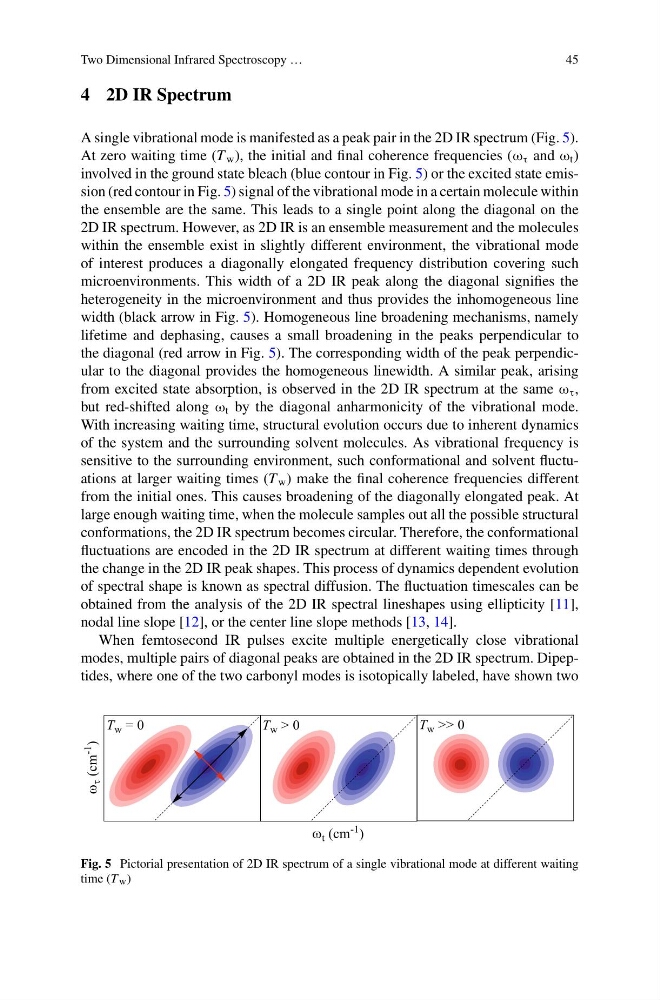
A single vibrational mode is manifested as a peak pair in the 2D IR spectrum (Fig. 5).
At zero waiting time (T w ), the initial and final coherence frequencies (ω τ and ω t )
involved in the ground state bleach (blue contour in Fig. 5) or the excited state emission (red contour in Fig. 5) signal of the vibrational mode in a certain molecule within
the ensemble are the same. This leads to a single point along the diagonal on the
2D IR spectrum. However, as 2D IR is an ensemble measurement and the molecules
within the ensemble exist in slightly different environment, the vibrational mode
of interest produces a diagonally elongated frequency distribution covering such
microenvironments. This width of a 2D IR peak along the diagonal signifies the
heterogeneity in the microenvironment and thus provides the inhomogeneous line
width (black arrow in Fig. 5). Homogeneous line broadening mechanisms, namely
lifetime and dephasing, causes a small broadening in the peaks perpendicular to
the diagonal (red arrow in Fig. 5). The corresponding width of the peak perpendicular to the diagonal provides the homogeneous linewidth. A similar peak, arising
from excited state absorption, is observed in the 2D IR spectrum at the same ω τ ,
but red-shifted along ω t by the diagonal anharmonicity of the vibrational mode.
With increasing waiting time, structural evolution occurs due to inherent dynamics
of the system and the surrounding solvent molecules. As vibrational frequency is
sensitive to the surrounding environment, such conformational and solvent fluctuations at larger waiting times (T w ) make the final coherence frequencies different
from the initial ones. This causes broadening of the diagonally elongated peak. At
large enough waiting time, when the molecule samples out all the possible structural
conformations, the 2D IR spectrum becomes circular. Therefore, the conformational
fluctuations are encoded in the 2D IR spectrum at different waiting times through
the change in the 2D IR peak shapes. This process of dynamics dependent evolution
of spectral shape is known as spectral diffusion. The fluctuation timescales can be
obtained from the analysis of the 2D IR spectral lineshapes using ellipticity [11],
nodal line slope [12], or the center line slope methods [13, 14].
When femtosecond IR pulses excite multiple energetically close vibrational
modes, multiple pairs of diagonal peaks are obtained in the 2D IR spectrum. Dipeptides, where one of the two carbonyl modes is isotopically labeled, have shown two
Fig. 5 Pictorial presentation of 2D IR spectrum of a single vibrational mode at different waiting
time (T w )
45
4 2D IR Spectrum
A single vibrational mode is manifested as a peak pair in the 2D IR spectrum (Fig. 5).
At zero waiting time (T w ), the initial and final coherence frequencies (ω τ and ω t )
involved in the ground state bleach (blue contour in Fig. 5) or the excited state emission (red contour in Fig. 5) signal of the vibrational mode in a certain molecule within
the ensemble are the same. This leads to a single point along the diagonal on the
2D IR spectrum. However, as 2D IR is an ensemble measurement and the molecules
within the ensemble exist in slightly different environment, the vibrational mode
of interest produces a diagonally elongated frequency distribution covering such
microenvironments. This width of a 2D IR peak along the diagonal signifies the
heterogeneity in the microenvironment and thus provides the inhomogeneous line
width (black arrow in Fig. 5). Homogeneous line broadening mechanisms, namely
lifetime and dephasing, causes a small broadening in the peaks perpendicular to
the diagonal (red arrow in Fig. 5). The corresponding width of the peak perpendicular to the diagonal provides the homogeneous linewidth. A similar peak, arising
from excited state absorption, is observed in the 2D IR spectrum at the same ω τ ,
but red-shifted along ω t by the diagonal anharmonicity of the vibrational mode.
With increasing waiting time, structural evolution occurs due to inherent dynamics
of the system and the surrounding solvent molecules. As vibrational frequency is
sensitive to the surrounding environment, such conformational and solvent fluctuations at larger waiting times (T w ) make the final coherence frequencies different
from the initial ones. This causes broadening of the diagonally elongated peak. At
large enough waiting time, when the molecule samples out all the possible structural
conformations, the 2D IR spectrum becomes circular. Therefore, the conformational
fluctuations are encoded in the 2D IR spectrum at different waiting times through
the change in the 2D IR peak shapes. This process of dynamics dependent evolution
of spectral shape is known as spectral diffusion. The fluctuation timescales can be
obtained from the analysis of the 2D IR spectral lineshapes using ellipticity [11],
nodal line slope [12], or the center line slope methods [13, 14].
When femtosecond IR pulses excite multiple energetically close vibrational
modes, multiple pairs of diagonal peaks are obtained in the 2D IR spectrum. Dipeptides, where one of the two carbonyl modes is isotopically labeled, have shown two
Fig. 5 Pictorial presentation of 2D IR spectrum of a single vibrational mode at different waiting
time (T w )