

Impedance Spectroscopy
517
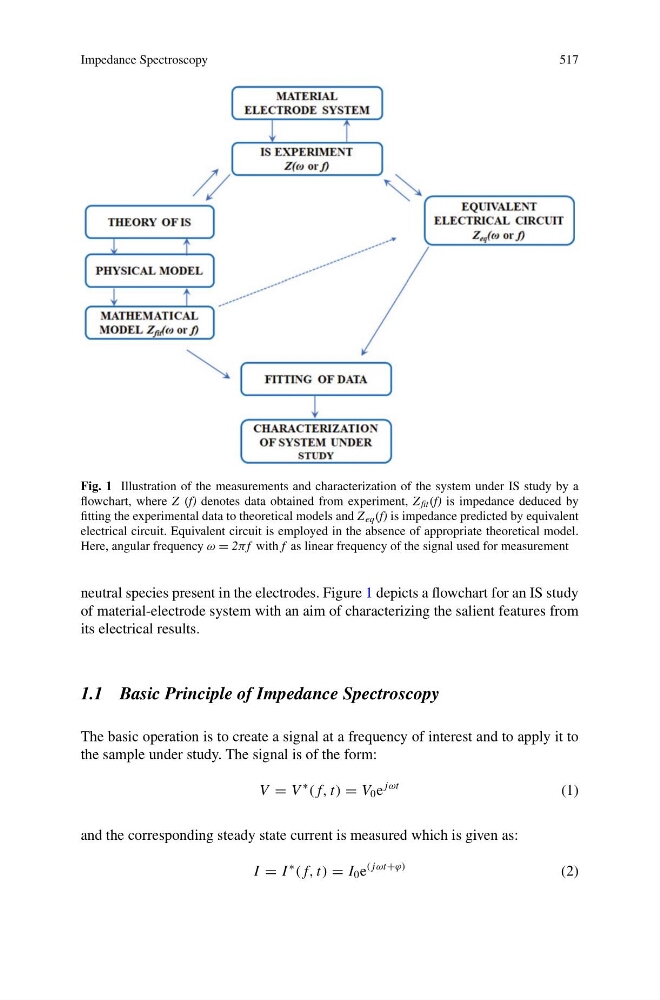
Fig. 1 Illustration of the measurements and characterization of the system under IS study by a
flowchart, where Z (f) denotes data obtained from experiment, Z fit (f) is impedance deduced by
fitting the experimental data to theoretical models and Z eq (f) is impedance predicted by equivalent
electrical circuit. Equivalent circuit is employed in the absence of appropriate theoretical model.
Here, angular frequency ω = 2π f with f as linear frequency of the signal used for measurement
neutral species present in the electrodes. Figure 1 depicts a flowchart for an IS study
of material-electrode system with an aim of characterizing the salient features from
its electrical results.
1.1 Basic Principle of Impedance Spectroscopy
The basic operation is to create a signal at a frequency of interest and to apply it to
the sample under study. The signal is of the form:
V = V
∗
( f, t) = V 0 e
jωt
(1)
and the corresponding steady state current is measured which is given as:
I = I
∗
( f, t) = I 0 e
( jωt+ϕ)
(2)
517
Fig. 1 Illustration of the measurements and characterization of the system under IS study by a
flowchart, where Z (f) denotes data obtained from experiment, Z fit (f) is impedance deduced by
fitting the experimental data to theoretical models and Z eq (f) is impedance predicted by equivalent
electrical circuit. Equivalent circuit is employed in the absence of appropriate theoretical model.
Here, angular frequency ω = 2π f with f as linear frequency of the signal used for measurement
neutral species present in the electrodes. Figure 1 depicts a flowchart for an IS study
of material-electrode system with an aim of characterizing the salient features from
its electrical results.
1.1 Basic Principle of Impedance Spectroscopy
The basic operation is to create a signal at a frequency of interest and to apply it to
the sample under study. The signal is of the form:
V = V
∗
( f, t) = V 0 e
jωt
(1)
and the corresponding steady state current is measured which is given as:
I = I
∗
( f, t) = I 0 e
( jωt+ϕ)
(2)