

Fundamentals of ATR-FTIR Spectroscopy and Its Role …
31
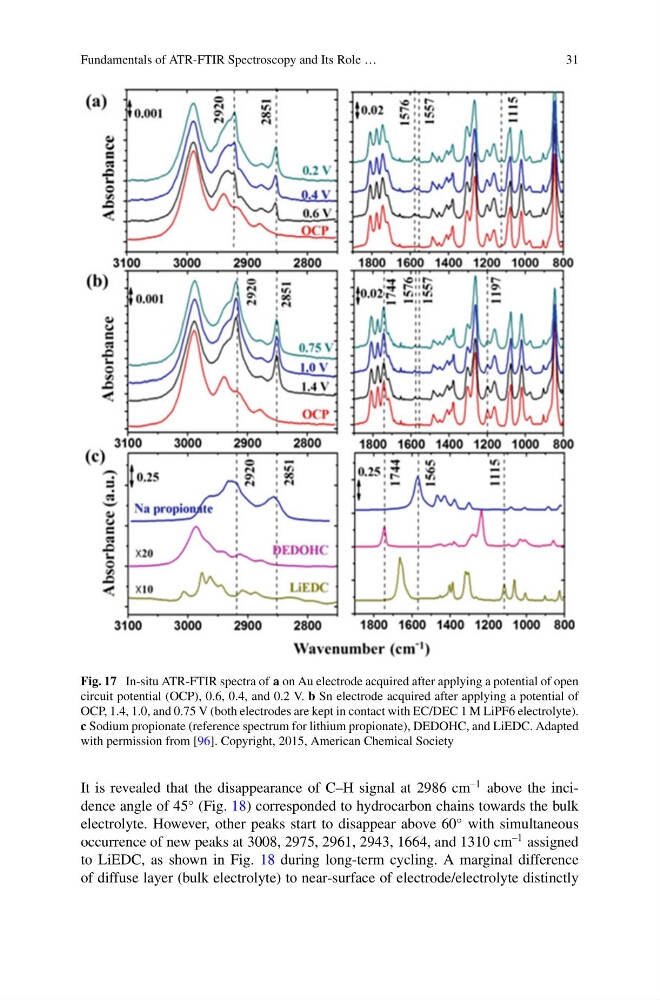
Fig. 17 In-situ ATR-FTIR spectra of a on Au electrode acquired after applying a potential of open
circuit potential (OCP), 0.6, 0.4, and 0.2 V. b Sn electrode acquired after applying a potential of
OCP, 1.4, 1.0, and 0.75 V (both electrodes are kept in contact with EC/DEC 1 M LiPF6 electrolyte).
c Sodium propionate (reference spectrum for lithium propionate), DEDOHC, and LiEDC. Adapted
with permission from [96]. Copyright, 2015, American Chemical Society
It is revealed that the disappearance of C–H signal at 2986 cm
–1 above the incidence angle of 45
◦ (Fig. 18) corresponded to hydrocarbon chains towards the bulk
electrolyte. However, other peaks start to disappear above 60
◦ with simultaneous
occurrence of new peaks at 3008, 2975, 2961, 2943, 1664, and 1310 cm
–1 assigned
to LiEDC, as shown in Fig. 18 during long-term cycling. A marginal difference
of diffuse layer (bulk electrolyte) to near-surface of electrode/electrolyte distinctly
31
Fig. 17 In-situ ATR-FTIR spectra of a on Au electrode acquired after applying a potential of open
circuit potential (OCP), 0.6, 0.4, and 0.2 V. b Sn electrode acquired after applying a potential of
OCP, 1.4, 1.0, and 0.75 V (both electrodes are kept in contact with EC/DEC 1 M LiPF6 electrolyte).
c Sodium propionate (reference spectrum for lithium propionate), DEDOHC, and LiEDC. Adapted
with permission from [96]. Copyright, 2015, American Chemical Society
It is revealed that the disappearance of C–H signal at 2986 cm
–1 above the incidence angle of 45
◦ (Fig. 18) corresponded to hydrocarbon chains towards the bulk
electrolyte. However, other peaks start to disappear above 60
◦ with simultaneous
occurrence of new peaks at 3008, 2975, 2961, 2943, 1664, and 1310 cm
–1 assigned
to LiEDC, as shown in Fig. 18 during long-term cycling. A marginal difference
of diffuse layer (bulk electrolyte) to near-surface of electrode/electrolyte distinctly