

Quantum Cascade Laser Spectroscopy
367
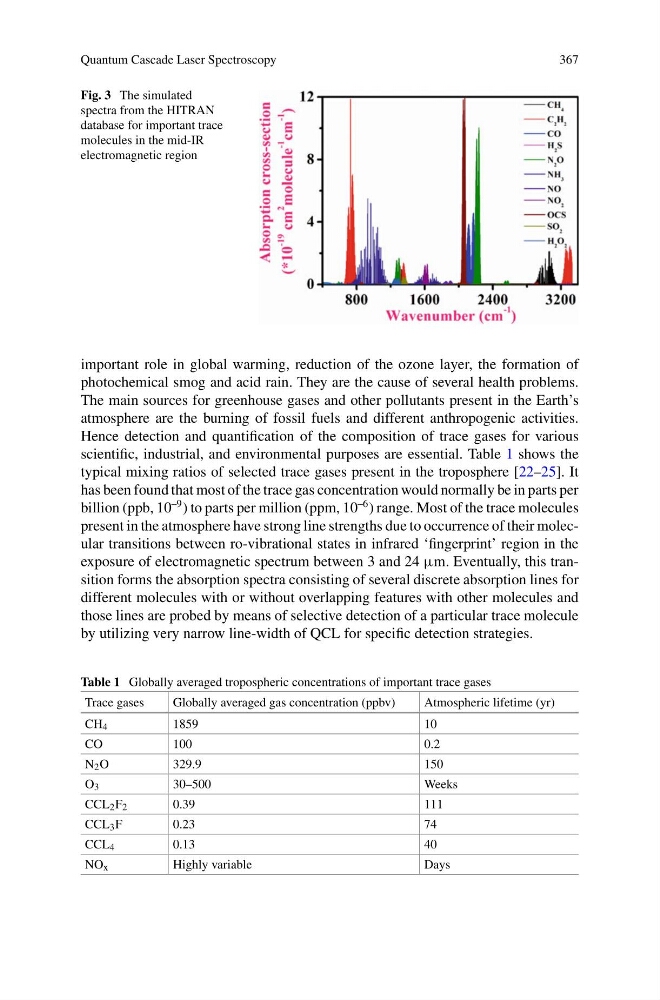
Fig. 3 The simulated
spectra from the HITRAN
database for important trace
molecules in the mid-IR
electromagnetic region
important role in global warming, reduction of the ozone layer, the formation of
photochemical smog and acid rain. They are the cause of several health problems.
The main sources for greenhouse gases and other pollutants present in the Earth’s
atmosphere are the burning of fossil fuels and different anthropogenic activities.
Hence detection and quantification of the composition of trace gases for various
scientific, industrial, and environmental purposes are essential. Table 1 shows the
typical mixing ratios of selected trace gases present in the troposphere [22–25]. It
has been found that most of the trace gas concentration would normally be in parts per
billion (ppb, 10
–9 ) to parts per million (ppm, 10
–6 ) range. Most of the trace molecules
present in the atmosphere have strong line strengths due to occurrence of their molecular transitions between ro-vibrational states in infrared ‘fingerprint’ region in the
exposure of electromagnetic spectrum between 3 and 24 μm. Eventually, this transition forms the absorption spectra consisting of several discrete absorption lines for
different molecules with or without overlapping features with other molecules and
those lines are probed by means of selective detection of a particular trace molecule
by utilizing very narrow line-width of QCL for specific detection strategies.
Table 1 Globally averaged tropospheric concentrations of important trace gases
Trace gases
Globally averaged gas concentration (ppbv)
Atmospheric lifetime (yr)
CH 4
1859
10
CO
100
0.2
N 2 O
329.9
150
O 3
30–500
Weeks
CCL 2 F 2
0.39
111
CCL 3 F
0.23
74
CCL 4
0.13
40
NO x
Highly variable
Days
367
Fig. 3 The simulated
spectra from the HITRAN
database for important trace
molecules in the mid-IR
electromagnetic region
important role in global warming, reduction of the ozone layer, the formation of
photochemical smog and acid rain. They are the cause of several health problems.
The main sources for greenhouse gases and other pollutants present in the Earth’s
atmosphere are the burning of fossil fuels and different anthropogenic activities.
Hence detection and quantification of the composition of trace gases for various
scientific, industrial, and environmental purposes are essential. Table 1 shows the
typical mixing ratios of selected trace gases present in the troposphere [22–25]. It
has been found that most of the trace gas concentration would normally be in parts per
billion (ppb, 10
–9 ) to parts per million (ppm, 10
–6 ) range. Most of the trace molecules
present in the atmosphere have strong line strengths due to occurrence of their molecular transitions between ro-vibrational states in infrared ‘fingerprint’ region in the
exposure of electromagnetic spectrum between 3 and 24 μm. Eventually, this transition forms the absorption spectra consisting of several discrete absorption lines for
different molecules with or without overlapping features with other molecules and
those lines are probed by means of selective detection of a particular trace molecule
by utilizing very narrow line-width of QCL for specific detection strategies.
Table 1 Globally averaged tropospheric concentrations of important trace gases
Trace gases
Globally averaged gas concentration (ppbv)
Atmospheric lifetime (yr)
CH 4
1859
10
CO
100
0.2
N 2 O
329.9
150
O 3
30–500
Weeks
CCL 2 F 2
0.39
111
CCL 3 F
0.23
74
CCL 4
0.13
40
NO x
Highly variable
Days