

Wavelength Modulation Spectroscopy
337
Fig. 7a in which the response to sinusoidal modulation applied at two points A and
B is shown. Note that the gas line shape acts essentially like an FM discriminator
detector circuit and converts the laser WM (or FM) to an IM scaled by the local slope
of the line shape. The response at B is larger because the local slope at B is larger
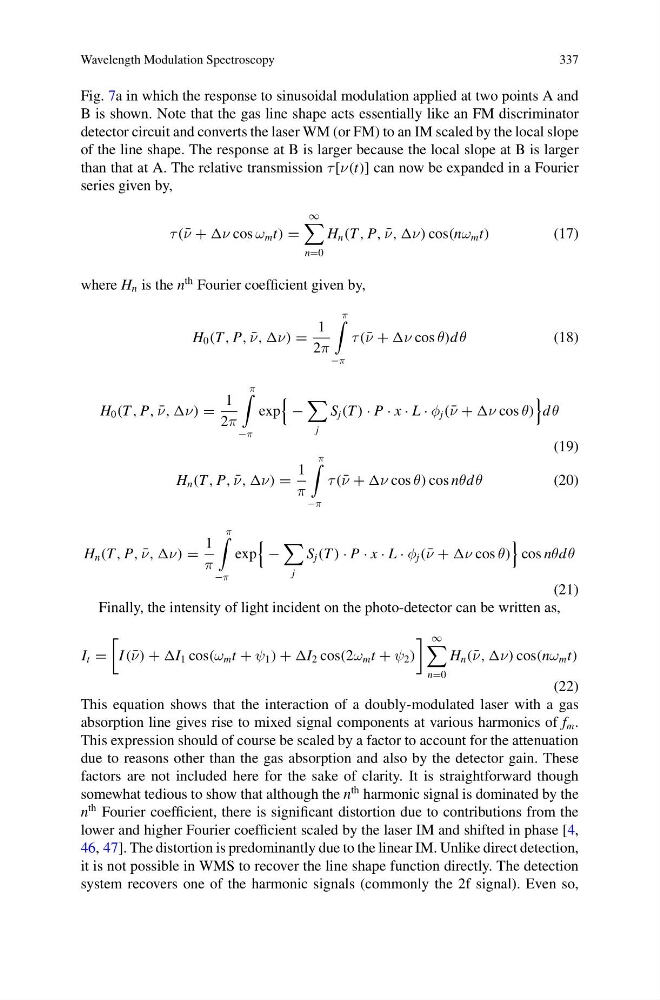
than that at A. The relative transmission τ [ν(t)] can now be expanded in a Fourier
series given by,
τ ( ¯
ν + ν cos ω m t) =
∞
n=0
H n (T , P, ¯
ν, ,ν) cos(nω m t)
(17)
where H n is the n
th Fourier coefficient given by,
H 0 (T , P, ¯
ν, ,ν) =
1
2π
π
−π
τ ( ¯
ν + ν cos θ)d θ
(18)
H 0 (T , P, ¯
ν, ,ν) =
1
2π
π
−π
exp
−
j
S j (T ) · P · x · L · φ j ( ¯
ν + ν cos θ)
d θ
(19)
H n (T , P, ¯
ν, ,ν) =
1
π
π
−π
τ ( ¯
ν + ν cos θ) cos nθd θ
(20)
H n (T , P, ¯
ν, ,ν) =
1
π
π
−π
exp
−
j
S j (T ) · P · x · L · φ j ( ¯
ν + ν cos θ)
cos nθd θ
(21)
Finally, the intensity of light incident on the photo-detector can be written as,
I t =
I ( ¯
ν) + I 1 cos(ω m t + ψ 1 ) + I 2 cos(2ω m t + ψ 2 )
∞
n=0
H n ( ¯
ν, ,ν) cos(nω m t)
(22)
This equation shows that the interaction of a doubly-modulated laser with a gas
absorption line gives rise to mixed signal components at various harmonics of f m .
This expression should of course be scaled by a factor to account for the attenuation
due to reasons other than the gas absorption and also by the detector gain. These
factors are not included here for the sake of clarity. It is straightforward though
somewhat tedious to show that although the n
th harmonic signal is dominated by the
n
th Fourier coefficient, there is significant distortion due to contributions from the
lower and higher Fourier coefficient scaled by the laser IM and shifted in phase [4,
46, 47]. The distortion is predominantly due to the linear IM. Unlike direct detection,
it is not possible in WMS to recover the line shape function directly. The detection
system recovers one of the harmonic signals (commonly the 2f signal). Even so,
337
Fig. 7a in which the response to sinusoidal modulation applied at two points A and
B is shown. Note that the gas line shape acts essentially like an FM discriminator
detector circuit and converts the laser WM (or FM) to an IM scaled by the local slope
of the line shape. The response at B is larger because the local slope at B is larger
than that at A. The relative transmission τ [ν(t)] can now be expanded in a Fourier
series given by,
τ ( ¯
ν + ν cos ω m t) =
∞
n=0
H n (T , P, ¯
ν, ,ν) cos(nω m t)
(17)
where H n is the n
th Fourier coefficient given by,
H 0 (T , P, ¯
ν, ,ν) =
1
2π
π
−π
τ ( ¯
ν + ν cos θ)d θ
(18)
H 0 (T , P, ¯
ν, ,ν) =
1
2π
π
−π
exp
−
j
S j (T ) · P · x · L · φ j ( ¯
ν + ν cos θ)
d θ
(19)
H n (T , P, ¯
ν, ,ν) =
1
π
π
−π
τ ( ¯
ν + ν cos θ) cos nθd θ
(20)
H n (T , P, ¯
ν, ,ν) =
1
π
π
−π
exp
−
j
S j (T ) · P · x · L · φ j ( ¯
ν + ν cos θ)
cos nθd θ
(21)
Finally, the intensity of light incident on the photo-detector can be written as,
I t =
I ( ¯
ν) + I 1 cos(ω m t + ψ 1 ) + I 2 cos(2ω m t + ψ 2 )
∞
n=0
H n ( ¯
ν, ,ν) cos(nω m t)
(22)
This equation shows that the interaction of a doubly-modulated laser with a gas
absorption line gives rise to mixed signal components at various harmonics of f m .
This expression should of course be scaled by a factor to account for the attenuation
due to reasons other than the gas absorption and also by the detector gain. These
factors are not included here for the sake of clarity. It is straightforward though
somewhat tedious to show that although the n
th harmonic signal is dominated by the
n
th Fourier coefficient, there is significant distortion due to contributions from the
lower and higher Fourier coefficient scaled by the laser IM and shifted in phase [4,
46, 47]. The distortion is predominantly due to the linear IM. Unlike direct detection,
it is not possible in WMS to recover the line shape function directly. The detection
system recovers one of the harmonic signals (commonly the 2f signal). Even so,