

Improving the Signal Strength and Detection Limits …
317
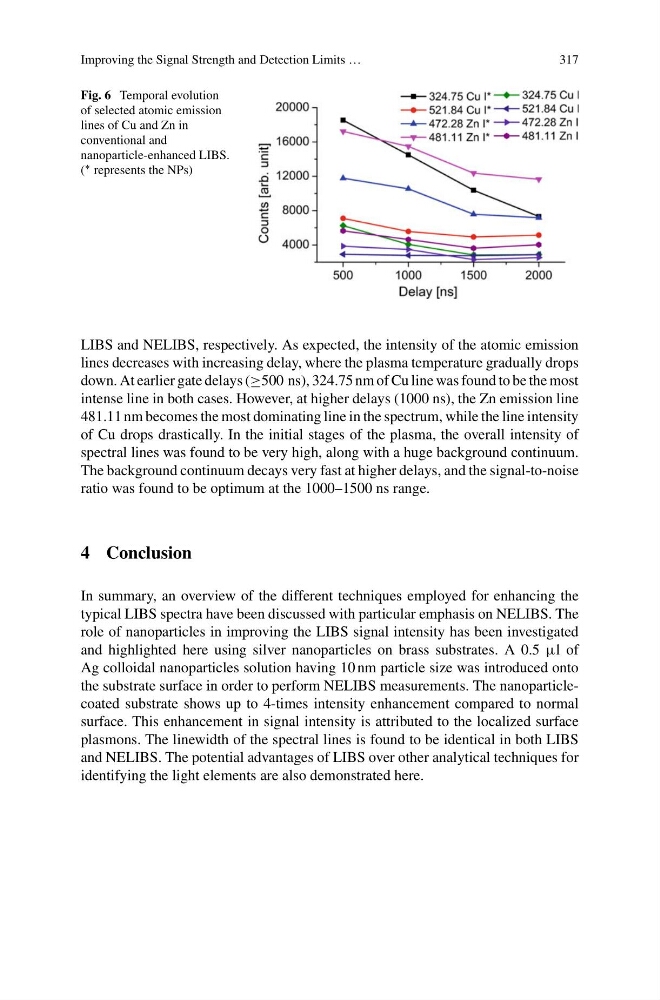
Fig. 6 Temporal evolution
of selected atomic emission
lines of Cu and Zn in
conventional and
nanoparticle-enhanced LIBS.
( ∗ represents the NPs)
LIBS and NELIBS, respectively. As expected, the intensity of the atomic emission
lines decreases with increasing delay, where the plasma temperature gradually drops
down. At earlier gate delays (≥500 ns), 324.75 nm of Cu line was found to be the most
intense line in both cases. However, at higher delays (1000 ns), the Zn emission line
481.11 nm becomes the most dominating line in the spectrum, while the line intensity
of Cu drops drastically. In the initial stages of the plasma, the overall intensity of
spectral lines was found to be very high, along with a huge background continuum.
The background continuum decays very fast at higher delays, and the signal-to-noise
ratio was found to be optimum at the 1000–1500 ns range.
4 Conclusion
In summary, an overview of the different techniques employed for enhancing the
typical LIBS spectra have been discussed with particular emphasis on NELIBS. The
role of nanoparticles in improving the LIBS signal intensity has been investigated
and highlighted here using silver nanoparticles on brass substrates. A 0.5 µl of
Ag colloidal nanoparticles solution having 10 nm particle size was introduced onto
the substrate surface in order to perform NELIBS measurements. The nanoparticlecoated substrate shows up to 4-times intensity enhancement compared to normal
surface. This enhancement in signal intensity is attributed to the localized surface
plasmons. The linewidth of the spectral lines is found to be identical in both LIBS
and NELIBS. The potential advantages of LIBS over other analytical techniques for
identifying the light elements are also demonstrated here.
317
Fig. 6 Temporal evolution
of selected atomic emission
lines of Cu and Zn in
conventional and
nanoparticle-enhanced LIBS.
( ∗ represents the NPs)
LIBS and NELIBS, respectively. As expected, the intensity of the atomic emission
lines decreases with increasing delay, where the plasma temperature gradually drops
down. At earlier gate delays (≥500 ns), 324.75 nm of Cu line was found to be the most
intense line in both cases. However, at higher delays (1000 ns), the Zn emission line
481.11 nm becomes the most dominating line in the spectrum, while the line intensity
of Cu drops drastically. In the initial stages of the plasma, the overall intensity of
spectral lines was found to be very high, along with a huge background continuum.
The background continuum decays very fast at higher delays, and the signal-to-noise
ratio was found to be optimum at the 1000–1500 ns range.
4 Conclusion
In summary, an overview of the different techniques employed for enhancing the
typical LIBS spectra have been discussed with particular emphasis on NELIBS. The
role of nanoparticles in improving the LIBS signal intensity has been investigated
and highlighted here using silver nanoparticles on brass substrates. A 0.5 µl of
Ag colloidal nanoparticles solution having 10 nm particle size was introduced onto
the substrate surface in order to perform NELIBS measurements. The nanoparticlecoated substrate shows up to 4-times intensity enhancement compared to normal
surface. This enhancement in signal intensity is attributed to the localized surface
plasmons. The linewidth of the spectral lines is found to be identical in both LIBS
and NELIBS. The potential advantages of LIBS over other analytical techniques for
identifying the light elements are also demonstrated here.