

Overview of Raman Spectroscopy: Fundamental to Applications
163
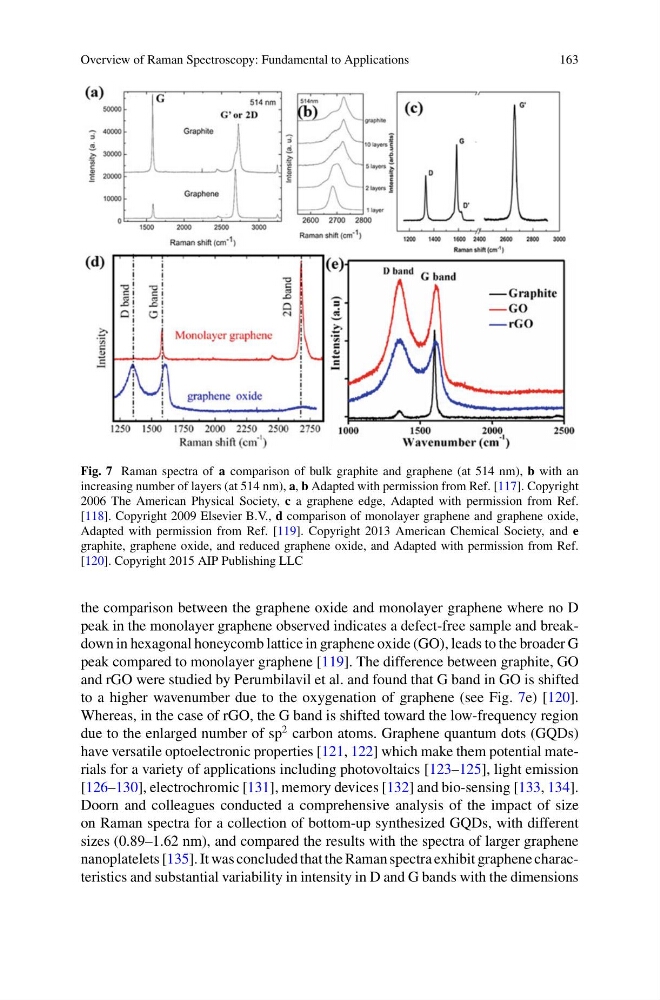
Fig. 7 Raman spectra of a comparison of bulk graphite and graphene (at 514 nm), b with an
increasing number of layers (at 514 nm), a, b Adapted with permission from Ref. [117]. Copyright
2006 The American Physical Society, c a graphene edge, Adapted with permission from Ref.
[118]. Copyright 2009 Elsevier B.V., d comparison of monolayer graphene and graphene oxide,
Adapted with permission from Ref. [119]. Copyright 2013 American Chemical Society, and e
graphite, graphene oxide, and reduced graphene oxide, and Adapted with permission from Ref.
[120]. Copyright 2015 AIP Publishing LLC
the comparison between the graphene oxide and monolayer graphene where no D
peak in the monolayer graphene observed indicates a defect-free sample and breakdown in hexagonal honeycomb lattice in graphene oxide (GO), leads to the broader G
peak compared to monolayer graphene [119]. The difference between graphite, GO
and rGO were studied by Perumbilavil et al. and found that G band in GO is shifted
to a higher wavenumber due to the oxygenation of graphene (see Fig. 7e) [120].
Whereas, in the case of rGO, the G band is shifted toward the low-frequency region
due to the enlarged number of sp
2 carbon atoms. Graphene quantum dots (GQDs)
have versatile optoelectronic properties [121, 122] which make them potential materials for a variety of applications including photovoltaics [123–125], light emission
[126–130], electrochromic [131], memory devices [132] and bio-sensing [133, 134].
Doorn and colleagues conducted a comprehensive analysis of the impact of size
on Raman spectra for a collection of bottom-up synthesized GQDs, with different
sizes (0.89–1.62 nm), and compared the results with the spectra of larger graphene
nanoplatelets [135]. It was concluded that the Raman spectra exhibit graphene characteristics and substantial variability in intensity in D and G bands with the dimensions
163
Fig. 7 Raman spectra of a comparison of bulk graphite and graphene (at 514 nm), b with an
increasing number of layers (at 514 nm), a, b Adapted with permission from Ref. [117]. Copyright
2006 The American Physical Society, c a graphene edge, Adapted with permission from Ref.
[118]. Copyright 2009 Elsevier B.V., d comparison of monolayer graphene and graphene oxide,
Adapted with permission from Ref. [119]. Copyright 2013 American Chemical Society, and e
graphite, graphene oxide, and reduced graphene oxide, and Adapted with permission from Ref.
[120]. Copyright 2015 AIP Publishing LLC
the comparison between the graphene oxide and monolayer graphene where no D
peak in the monolayer graphene observed indicates a defect-free sample and breakdown in hexagonal honeycomb lattice in graphene oxide (GO), leads to the broader G
peak compared to monolayer graphene [119]. The difference between graphite, GO
and rGO were studied by Perumbilavil et al. and found that G band in GO is shifted
to a higher wavenumber due to the oxygenation of graphene (see Fig. 7e) [120].
Whereas, in the case of rGO, the G band is shifted toward the low-frequency region
due to the enlarged number of sp
2 carbon atoms. Graphene quantum dots (GQDs)
have versatile optoelectronic properties [121, 122] which make them potential materials for a variety of applications including photovoltaics [123–125], light emission
[126–130], electrochromic [131], memory devices [132] and bio-sensing [133, 134].
Doorn and colleagues conducted a comprehensive analysis of the impact of size
on Raman spectra for a collection of bottom-up synthesized GQDs, with different
sizes (0.89–1.62 nm), and compared the results with the spectra of larger graphene
nanoplatelets [135]. It was concluded that the Raman spectra exhibit graphene characteristics and substantial variability in intensity in D and G bands with the dimensions