

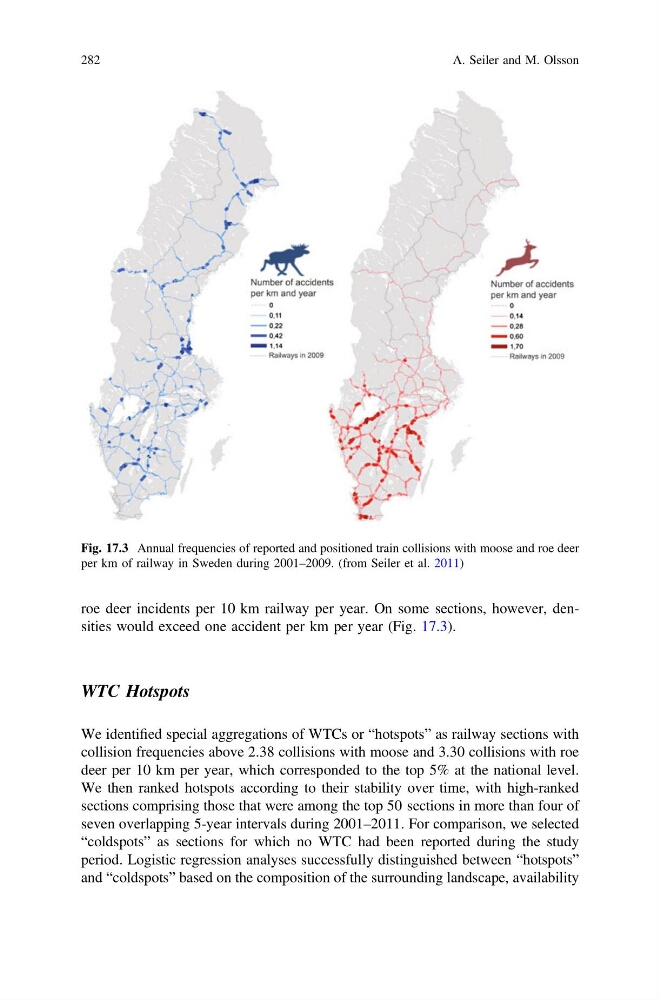
roe deer incidents per 10 km railway per year. On some sections, however, densities would exceed one accident per km per year (Fig. 17.3).
WTC Hotspots
We identified special aggregations of WTCs or “hotspots” as railway sections with
collision frequencies above 2.38 collisions with moose and 3.30 collisions with roe
deer per 10 km per year, which corresponded to the top 5% at the national level.
We then ranked hotspots according to their stability over time, with high-ranked
sections comprising those that were among the top 50 sections in more than four of
seven overlapping 5-year intervals during 2001–2011. For comparison, we selected
“coldspots” as sections for which no WTC had been reported during the study
period. Logistic regression analyses successfully distinguished between “hotspots”
and “coldspots” based on the composition of the surrounding landscape, availability
Fig. 17.3 Annual frequencies of reported and positioned train collisions with moose and roe deer
per km of railway in Sweden during 2001–2009. (from Seiler et al. 2011)
282
A. Seiler and M. Olsson
WTC Hotspots
We identified special aggregations of WTCs or “hotspots” as railway sections with
collision frequencies above 2.38 collisions with moose and 3.30 collisions with roe
deer per 10 km per year, which corresponded to the top 5% at the national level.
We then ranked hotspots according to their stability over time, with high-ranked
sections comprising those that were among the top 50 sections in more than four of
seven overlapping 5-year intervals during 2001–2011. For comparison, we selected
“coldspots” as sections for which no WTC had been reported during the study
period. Logistic regression analyses successfully distinguished between “hotspots”
and “coldspots” based on the composition of the surrounding landscape, availability
Fig. 17.3 Annual frequencies of reported and positioned train collisions with moose and roe deer
per km of railway in Sweden during 2001–2009. (from Seiler et al. 2011)
282
A. Seiler and M. Olsson