

wounded animals. We compiled these reports and analyzed spatial and temporal
patterns in the distribution of WTCs. We also surveyed train drivers regarding their
experiences with wildlife on railways and wildlife-train collisions. These studies
provided the framework for the preparation of the current mitigation project, whose
main findings are summarized below. The major objectives were to evaluate the
magnitude of the problem, obtain input on potential mitigation measures, analyze
spatial and temporal patterns, and identify the hotspots where mitigation might be
most urgently required.
Train Driver Survey
In 2010, we conducted a survey with train drivers to map their experiences with
WTCs (Seiler et al. 2011). Drivers were asked about how often they observed
animals on or near the railway, how often they experienced collisions with ungulates, and how animals typically responded to the oncoming train. Train drivers
were also asked for their opinions and ideas on how to reduce WTCs. About 17% of
the 1,023 participants took an active part in the survey, and over 65% of the
respondents replied that they encountered deer several times a week. Most
respondents (91%) had experienced collisions with roe deer (49.3%), moose
(23.5%), reindeer (19.4%), and other larger wildlife (7.8%) during the previous
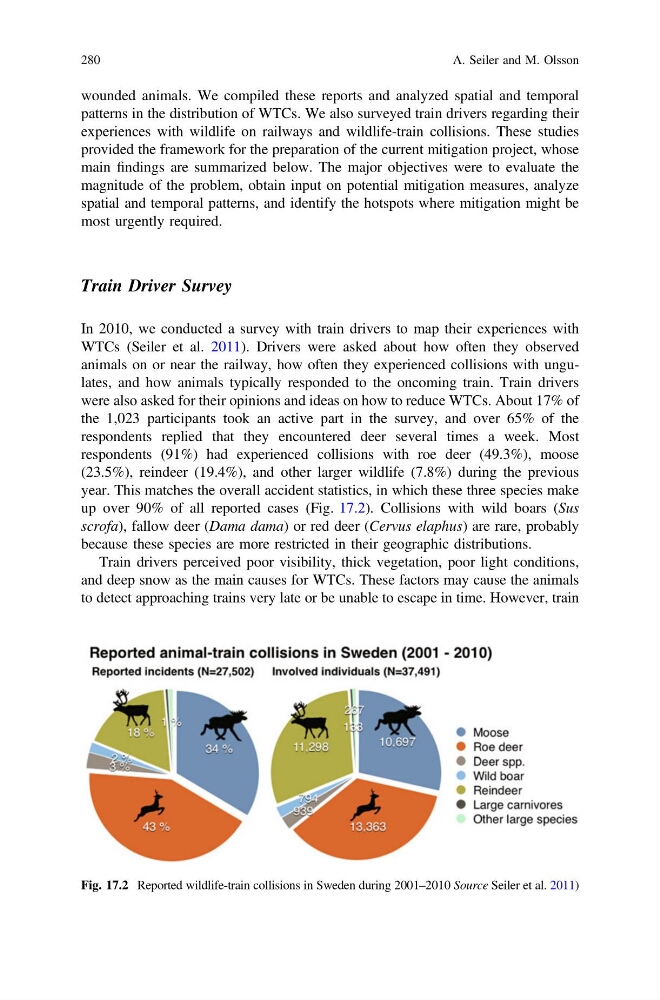
year. This matches the overall accident statistics, in which these three species make
up over 90% of all reported cases (Fig. 17.2). Collisions with wild boars (Sus
scrofa), fallow deer (Dama dama) or red deer (Cervus elaphus) are rare, probably
because these species are more restricted in their geographic distributions.
Train drivers perceived poor visibility, thick vegetation, poor light conditions,
and deep snow as the main causes for WTCs. These factors may cause the animals
to detect approaching trains very late or be unable to escape in time. However, train
Fig. 17.2 Reported wildlife-train collisions in Sweden during 2001–2010 Source Seiler et al. 2011)
280
A. Seiler and M. Olsson
patterns in the distribution of WTCs. We also surveyed train drivers regarding their
experiences with wildlife on railways and wildlife-train collisions. These studies
provided the framework for the preparation of the current mitigation project, whose
main findings are summarized below. The major objectives were to evaluate the
magnitude of the problem, obtain input on potential mitigation measures, analyze
spatial and temporal patterns, and identify the hotspots where mitigation might be
most urgently required.
Train Driver Survey
In 2010, we conducted a survey with train drivers to map their experiences with
WTCs (Seiler et al. 2011). Drivers were asked about how often they observed
animals on or near the railway, how often they experienced collisions with ungulates, and how animals typically responded to the oncoming train. Train drivers
were also asked for their opinions and ideas on how to reduce WTCs. About 17% of
the 1,023 participants took an active part in the survey, and over 65% of the
respondents replied that they encountered deer several times a week. Most
respondents (91%) had experienced collisions with roe deer (49.3%), moose
(23.5%), reindeer (19.4%), and other larger wildlife (7.8%) during the previous
year. This matches the overall accident statistics, in which these three species make
up over 90% of all reported cases (Fig. 17.2). Collisions with wild boars (Sus
scrofa), fallow deer (Dama dama) or red deer (Cervus elaphus) are rare, probably
because these species are more restricted in their geographic distributions.
Train drivers perceived poor visibility, thick vegetation, poor light conditions,
and deep snow as the main causes for WTCs. These factors may cause the animals
to detect approaching trains very late or be unable to escape in time. However, train
Fig. 17.2 Reported wildlife-train collisions in Sweden during 2001–2010 Source Seiler et al. 2011)
280
A. Seiler and M. Olsson