

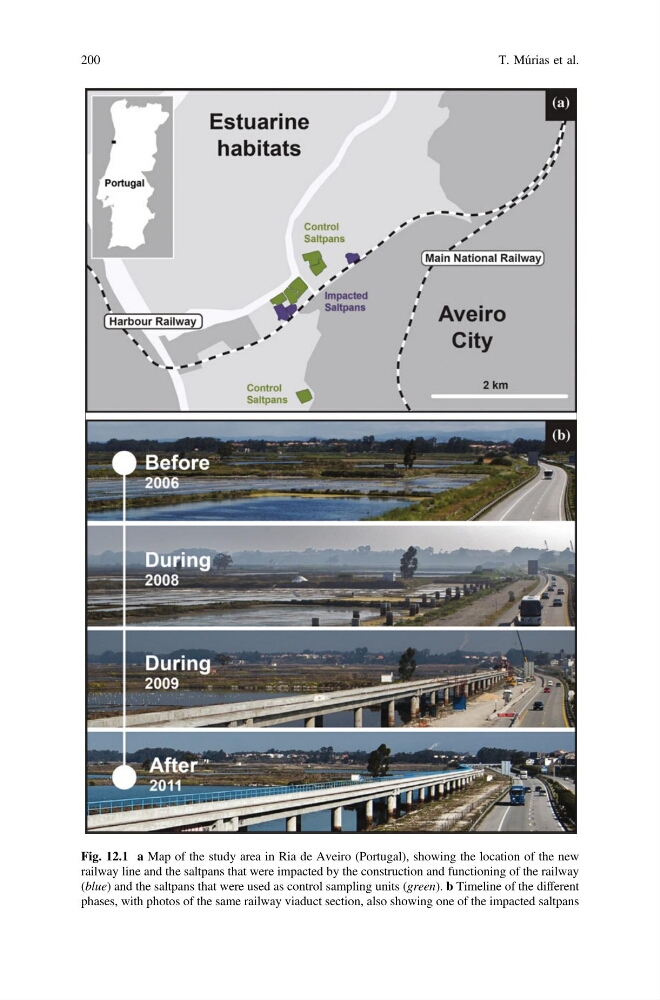
Fig. 12.1 a Map of the study area in Ria de Aveiro (Portugal), showing the location of the new
railway line and the saltpans that were impacted by the construction and functioning of the railway
(blue) and the saltpans that were used as control sampling units (green). b Timeline of the different
phases, with photos of the same railway viaduct section, also showing one of the impacted saltpans
200
T. Múrias et al.
railway line and the saltpans that were impacted by the construction and functioning of the railway
(blue) and the saltpans that were used as control sampling units (green). b Timeline of the different
phases, with photos of the same railway viaduct section, also showing one of the impacted saltpans
200
T. Múrias et al.