

problem is that mortality surveys were carried out at monthly intervals and only on
one or two days per month, which may influence mortality estimates (Santos et al.
2011, 2015). For instance, an eventual mass mortality event due to a flock colliding
with a train might go unnoticed, if it occurs after a monthly survey and corpses decay
or are removed until the next survey (Santos et al. 2011). The problem may be
particularly serious for small passerines, because their corpses are likely to persist for
very short periods in the railway, thereby causing underestimation of the mortality
rate (Santos et al. 2011) and making it difficult to precisely estimate the location of
mortality hotspots (Santos et al. 2015). However, the main focus of this study was on
aquatic birds, which tend to be relatively large and thus less affected by very short
persistence times. Furthermore, a collision with a flock of large birds would likely be
detected by the train driver and then reported to the safety department. Also, the
observation that mortality hotspots were coincident with wetland crossings is unlikely to be due to survey bias, given that the number of bird corpses per km and
survey day detected therein was more than 10 times higher than anywhere else along
this railway. This number might be even greater, because some birds colliding with
trains on the wetland bridges could be thrown to the surrounding water or other wet
habitats, where they would likely decay rapidly or otherwise go unnoticed by
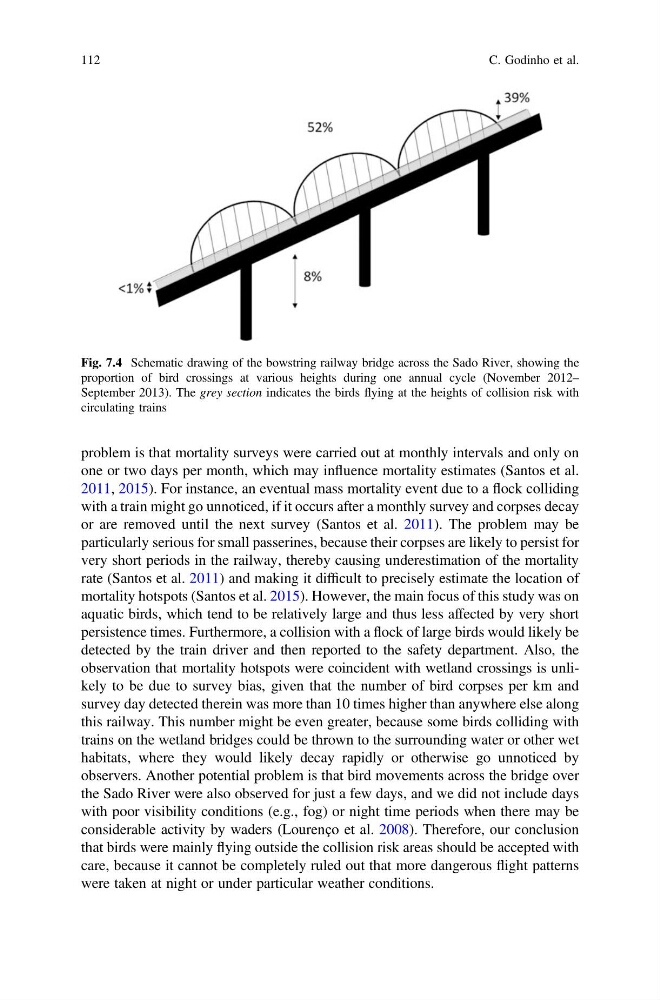
observers. Another potential problem is that bird movements across the bridge over
the Sado River were also observed for just a few days, and we did not include days
with poor visibility conditions (e.g., fog) or night time periods when there may be
considerable activity by waders (Lourenço et al. 2008). Therefore, our conclusion
that birds were mainly flying outside the collision risk areas should be accepted with
care, because it cannot be completely ruled out that more dangerous flight patterns
were taken at night or under particular weather conditions.
Fig. 7.4 Schematic drawing of the bowstring railway bridge across the Sado River, showing the
proportion of bird crossings at various heights during one annual cycle (November 2012–
September 2013). The grey section indicates the birds flying at the heights of collision risk with
circulating trains
112
C. Godinho et al.
one or two days per month, which may influence mortality estimates (Santos et al.
2011, 2015). For instance, an eventual mass mortality event due to a flock colliding
with a train might go unnoticed, if it occurs after a monthly survey and corpses decay
or are removed until the next survey (Santos et al. 2011). The problem may be
particularly serious for small passerines, because their corpses are likely to persist for
very short periods in the railway, thereby causing underestimation of the mortality
rate (Santos et al. 2011) and making it difficult to precisely estimate the location of
mortality hotspots (Santos et al. 2015). However, the main focus of this study was on
aquatic birds, which tend to be relatively large and thus less affected by very short
persistence times. Furthermore, a collision with a flock of large birds would likely be
detected by the train driver and then reported to the safety department. Also, the
observation that mortality hotspots were coincident with wetland crossings is unlikely to be due to survey bias, given that the number of bird corpses per km and
survey day detected therein was more than 10 times higher than anywhere else along
this railway. This number might be even greater, because some birds colliding with
trains on the wetland bridges could be thrown to the surrounding water or other wet
habitats, where they would likely decay rapidly or otherwise go unnoticed by
observers. Another potential problem is that bird movements across the bridge over
the Sado River were also observed for just a few days, and we did not include days
with poor visibility conditions (e.g., fog) or night time periods when there may be
considerable activity by waders (Lourenço et al. 2008). Therefore, our conclusion
that birds were mainly flying outside the collision risk areas should be accepted with
care, because it cannot be completely ruled out that more dangerous flight patterns
were taken at night or under particular weather conditions.
Fig. 7.4 Schematic drawing of the bowstring railway bridge across the Sado River, showing the
proportion of bird crossings at various heights during one annual cycle (November 2012–
September 2013). The grey section indicates the birds flying at the heights of collision risk with
circulating trains
112
C. Godinho et al.