

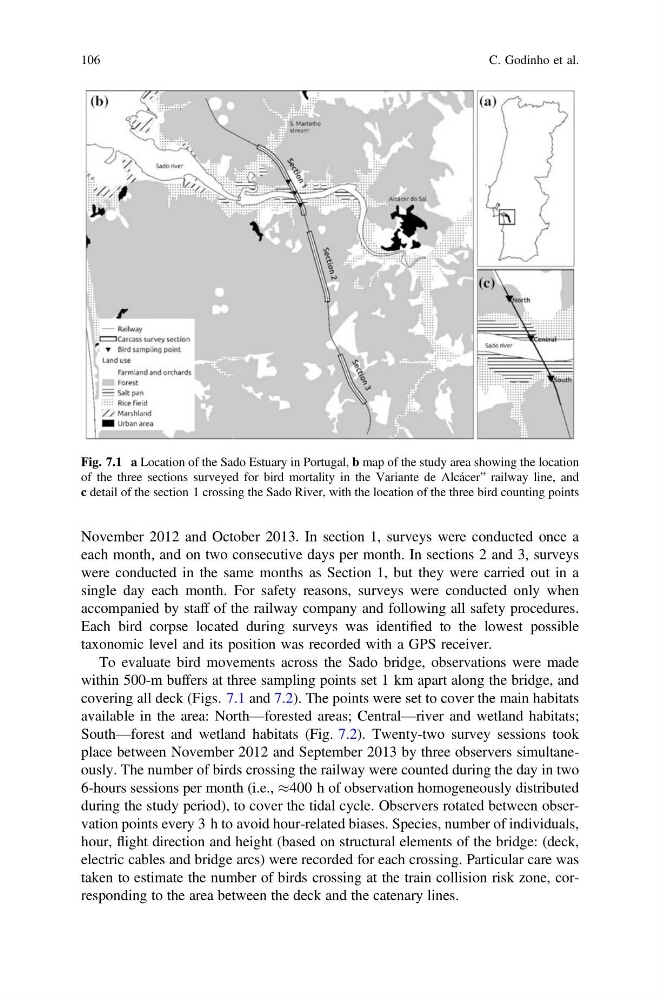
Fig. 7.1 a Location of the Sado Estuary in Portugal, b map of the study area showing the location
of the three sections surveyed for bird mortality in the Variante de Alcácer” railway line, and
c detail of the section 1 crossing the Sado River, with the location of the three bird counting points
November 2012 and October 2013. In section 1, surveys were conducted once a
each month, and on two consecutive days per month. In sections 2 and 3, surveys
were conducted in the same months as Section 1, but they were carried out in a
single day each month. For safety reasons, surveys were conducted only when
accompanied by staff of the railway company and following all safety procedures.
Each bird corpse located during surveys was identified to the lowest possible
taxonomic level and its position was recorded with a GPS receiver.
To evaluate bird movements across the Sado bridge, observations were made
within 500-m buffers at three sampling points set 1 km apart along the bridge, and
covering all deck (Figs. 7.1 and 7.2). The points were set to cover the main habitats
available in the area: North—forested areas; Central—river and wetland habitats;
South—forest and wetland habitats (Fig. 7.2). Twenty-two survey sessions took
place between November 2012 and September 2013 by three observers simultaneously. The number of birds crossing the railway were counted during the day in two
6-hours sessions per month (i.e., %400 h of observation homogeneously distributed
during the study period), to cover the tidal cycle. Observers rotated between observation points every 3 h to avoid hour-related biases. Species, number of individuals,
hour, flight direction and height (based on structural elements of the bridge: (deck,
electric cables and bridge arcs) were recorded for each crossing. Particular care was
taken to estimate the number of birds crossing at the train collision risk zone, corresponding to the area between the deck and the catenary lines.
106
C. Godinho et al.
of the three sections surveyed for bird mortality in the Variante de Alcácer” railway line, and
c detail of the section 1 crossing the Sado River, with the location of the three bird counting points
November 2012 and October 2013. In section 1, surveys were conducted once a
each month, and on two consecutive days per month. In sections 2 and 3, surveys
were conducted in the same months as Section 1, but they were carried out in a
single day each month. For safety reasons, surveys were conducted only when
accompanied by staff of the railway company and following all safety procedures.
Each bird corpse located during surveys was identified to the lowest possible
taxonomic level and its position was recorded with a GPS receiver.
To evaluate bird movements across the Sado bridge, observations were made
within 500-m buffers at three sampling points set 1 km apart along the bridge, and
covering all deck (Figs. 7.1 and 7.2). The points were set to cover the main habitats
available in the area: North—forested areas; Central—river and wetland habitats;
South—forest and wetland habitats (Fig. 7.2). Twenty-two survey sessions took
place between November 2012 and September 2013 by three observers simultaneously. The number of birds crossing the railway were counted during the day in two
6-hours sessions per month (i.e., %400 h of observation homogeneously distributed
during the study period), to cover the tidal cycle. Observers rotated between observation points every 3 h to avoid hour-related biases. Species, number of individuals,
hour, flight direction and height (based on structural elements of the bridge: (deck,
electric cables and bridge arcs) were recorded for each crossing. Particular care was
taken to estimate the number of birds crossing at the train collision risk zone, corresponding to the area between the deck and the catenary lines.
106
C. Godinho et al.