

3.2 Lagrangian Approach to Mixing
41
Bertsch et al. [27] used particle tracking to get quantitative indication of mixing
together with experiments. Wang et al. [28] numerically investigated mixing in
a microchannel with patterned grooves using particle tracking algorithm based
on fourth-order adaptive Runge–Kutta integration scheme. Poincaré maps were
developed and analyzed to study the phenomenon of chaotic advection. Aubin et al.
[29, 30] performed numerical simulations to compute the flow field for continuous
phase in a micromixer, and 2,480 evenly distributed particles placed on right-hand
side of the mixer inlet were tracked using 4th-order Runge–Kutta scheme with
adaptive step size. Using the particle tracking data, mixing analysis was presented
with spatial distribution of particles on a cross-sectional plane, maximum striation
thickness and residence time distributions.
Jiang et al. [26] constructed Poincaré maps from the data collected by tracking a
large number of particles in a curved microchannel. The velocity field was obtained
from numerical simulation, and the particles were tracked using second-order Runge–
Kutta scheme with adaptive step-size control with a commercial post-processing
software, Fieldview9® (Intelligent Light). A Lagrangian particle tracking method
was used to calculate the trajectories of the massless fluid particles inside the flow
using ANSYS-Fluent 12.1 [33] by Afzal and Kim [32] for design optimization of
a staggered herringbone micromixer. In order to integrate the equation of motion, a
combination of implicit Euler and 5th-order Runge–Kutta (derived from Cash and
Karp [33]) schemes with adaptive step sizes was employed using an embedded error
control. The algorithm switches between the lower (implicit Euler) and higher (5thorder Runge–Kutta) order schemes for better solution accuracy and stability. This
method was employed to study the advection of particles inside the flow.
3.3 Mixing Quantification
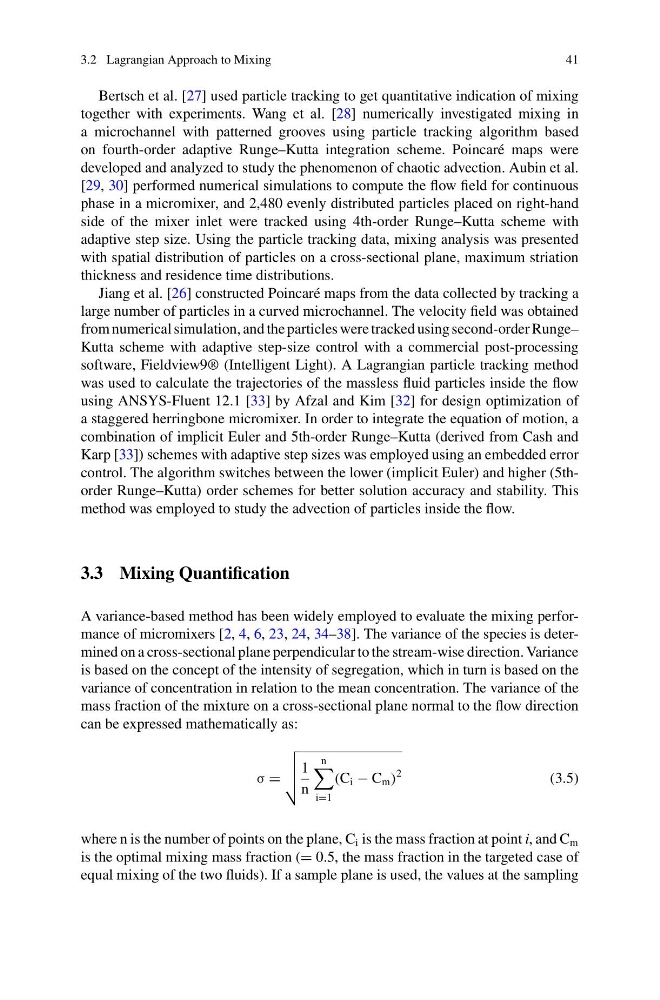
A variance-based method has been widely employed to evaluate the mixing performance of micromixers [2, 4, 6, 23, 24, 34–38]. The variance of the species is determined on a cross-sectional plane perpendicular to the stream-wise direction. Variance
is based on the concept of the intensity of segregation, which in turn is based on the
variance of concentration in relation to the mean concentration. The variance of the
mass fraction of the mixture on a cross-sectional plane normal to the flow direction
can be expressed mathematically as:
σ =
1
n
n
i=1
(C i − C m )
2
(3.5)
where n is the number of points on the plane, C i is the mass fraction at point i, and C m
is the optimal mixing mass fraction (= 0.5, the mass fraction in the targeted case of
equal mixing of the two fluids). If a sample plane is used, the values at the sampling
41
Bertsch et al. [27] used particle tracking to get quantitative indication of mixing
together with experiments. Wang et al. [28] numerically investigated mixing in
a microchannel with patterned grooves using particle tracking algorithm based
on fourth-order adaptive Runge–Kutta integration scheme. Poincaré maps were
developed and analyzed to study the phenomenon of chaotic advection. Aubin et al.
[29, 30] performed numerical simulations to compute the flow field for continuous
phase in a micromixer, and 2,480 evenly distributed particles placed on right-hand
side of the mixer inlet were tracked using 4th-order Runge–Kutta scheme with
adaptive step size. Using the particle tracking data, mixing analysis was presented
with spatial distribution of particles on a cross-sectional plane, maximum striation
thickness and residence time distributions.
Jiang et al. [26] constructed Poincaré maps from the data collected by tracking a
large number of particles in a curved microchannel. The velocity field was obtained
from numerical simulation, and the particles were tracked using second-order Runge–
Kutta scheme with adaptive step-size control with a commercial post-processing
software, Fieldview9® (Intelligent Light). A Lagrangian particle tracking method
was used to calculate the trajectories of the massless fluid particles inside the flow
using ANSYS-Fluent 12.1 [33] by Afzal and Kim [32] for design optimization of
a staggered herringbone micromixer. In order to integrate the equation of motion, a
combination of implicit Euler and 5th-order Runge–Kutta (derived from Cash and
Karp [33]) schemes with adaptive step sizes was employed using an embedded error
control. The algorithm switches between the lower (implicit Euler) and higher (5thorder Runge–Kutta) order schemes for better solution accuracy and stability. This
method was employed to study the advection of particles inside the flow.
3.3 Mixing Quantification
A variance-based method has been widely employed to evaluate the mixing performance of micromixers [2, 4, 6, 23, 24, 34–38]. The variance of the species is determined on a cross-sectional plane perpendicular to the stream-wise direction. Variance
is based on the concept of the intensity of segregation, which in turn is based on the
variance of concentration in relation to the mean concentration. The variance of the
mass fraction of the mixture on a cross-sectional plane normal to the flow direction
can be expressed mathematically as:
σ =
1
n
n
i=1
(C i − C m )
2
(3.5)
where n is the number of points on the plane, C i is the mass fraction at point i, and C m
is the optimal mixing mass fraction (= 0.5, the mass fraction in the targeted case of
equal mixing of the two fluids). If a sample plane is used, the values at the sampling