

GDP of $72 trillion. So what do these impressive numbers say about ubiquitous
scarcity and thus the endless need to grow?
A proper examination of which resources are scarce, which are not, and how all
of them are allocated, pushes economic accounting to the sidelines and puts ethics,
political will and power relations center stage. We see utterly wasteful and unjust
consumption, production and distribution patterns.
Tracking the actual output of food, for example, shows that we have what we need
to feed everyone well. According to the UN’s Food and Agriculture Organization,
roughly one third of what is produced for human consumption is never eaten. This
amounts to about 1.3 billion tons per year. Examining the figures by country, we see
that people in Sub-Saharan Africa, South as well as South East Asia only waste
around 6–10 kg per person per year whereas Europeans and North Americans throw
away between 95 and 115 kg of perfectly edible food (FAO 2011: v).
This pattern is repeated with other goods as well. In Britain around 30 % of the
contents of the average wardrobe has not been worn for at least a year, which gives
us the figure of 1.7 billion items of clothing unused in the United Kingdom alone
(Gracey/Moon 2012: 2).
In 2006, the McKinsey Global Institute calculated that the world’s financial
markets struggled to find investment opportunities for about 3.5 times global GDP
at the time. This was the staggering figure of $167 trillion in desperate liquidity
(Farrell et al. 2008: 7) at the same time that the international community could not
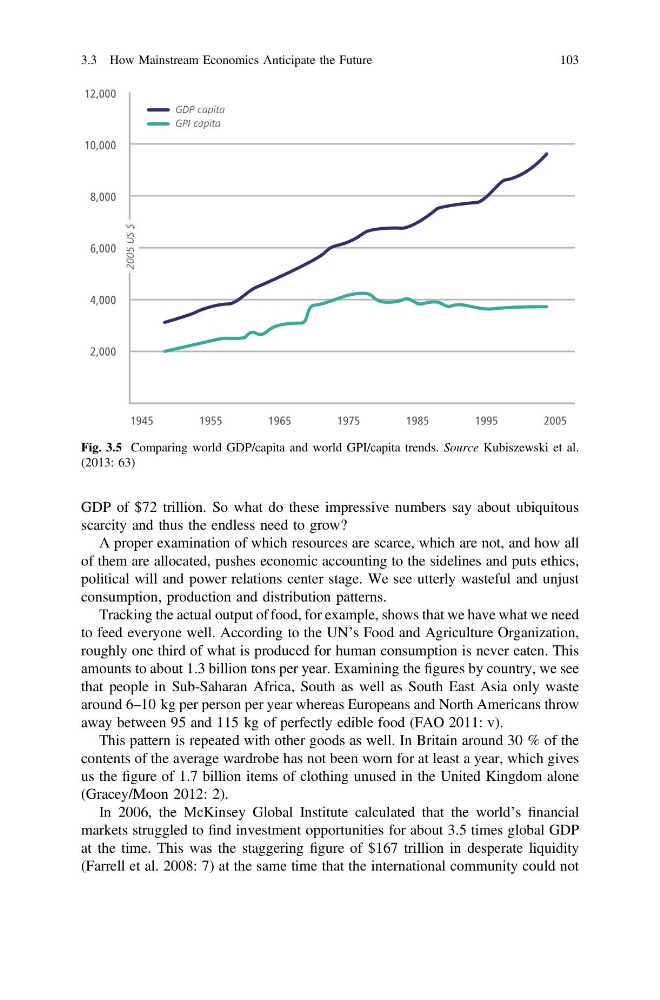
Fig. 3.5 Comparing world GDP/capita and world GPI/capita trends. Source Kubiszewski et al.
(2013: 63)
3.3 How Mainstream Economics Anticipate the Future
103
scarcity and thus the endless need to grow?
A proper examination of which resources are scarce, which are not, and how all
of them are allocated, pushes economic accounting to the sidelines and puts ethics,
political will and power relations center stage. We see utterly wasteful and unjust
consumption, production and distribution patterns.
Tracking the actual output of food, for example, shows that we have what we need
to feed everyone well. According to the UN’s Food and Agriculture Organization,
roughly one third of what is produced for human consumption is never eaten. This
amounts to about 1.3 billion tons per year. Examining the figures by country, we see
that people in Sub-Saharan Africa, South as well as South East Asia only waste
around 6–10 kg per person per year whereas Europeans and North Americans throw
away between 95 and 115 kg of perfectly edible food (FAO 2011: v).
This pattern is repeated with other goods as well. In Britain around 30 % of the
contents of the average wardrobe has not been worn for at least a year, which gives
us the figure of 1.7 billion items of clothing unused in the United Kingdom alone
(Gracey/Moon 2012: 2).
In 2006, the McKinsey Global Institute calculated that the world’s financial
markets struggled to find investment opportunities for about 3.5 times global GDP
at the time. This was the staggering figure of $167 trillion in desperate liquidity
(Farrell et al. 2008: 7) at the same time that the international community could not
Fig. 3.5 Comparing world GDP/capita and world GPI/capita trends. Source Kubiszewski et al.
(2013: 63)
3.3 How Mainstream Economics Anticipate the Future
103