

5 Conclusions
When performing Monte Carlo analysis, it is very helpful to have access to the
results of each simulation as well as to the corresponding values of the variable
parameters. Thanks to these datasets, made available here by the software
RangeLCA, valuable ways of presenting the results have been proposed in the
paper. They have been illustrated for one impact category, with the help of a real
case study.
Range graphs represent the variable results of each system studied as clouds of
points. The sensitivity of the results to a parameter can be highlighted and the
amplitude of the variability can be visualized through the cloud shape. This
approach plays an important role in iterative LCA in defining priorities for data and
model refining. In case of comparative LCA, result differences between two systems can be plotted for all simulations, either against one parameter (delta graphs)
and by combining the variability of two parameters (areas of relevance).
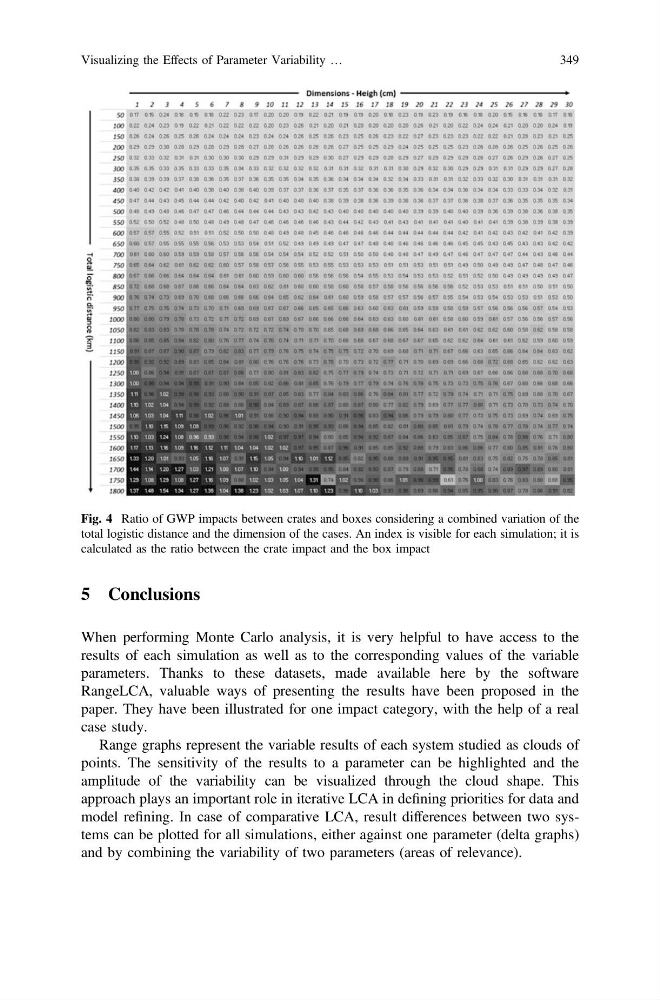
Fig. 4 Ratio of GWP impacts between crates and boxes considering a combined variation of the
total logistic distance and the dimension of the cases. An index is visible for each simulation; it is
calculated as the ratio between the crate impact and the box impact
Visualizing the Effects of Parameter Variability …
349
When performing Monte Carlo analysis, it is very helpful to have access to the
results of each simulation as well as to the corresponding values of the variable
parameters. Thanks to these datasets, made available here by the software
RangeLCA, valuable ways of presenting the results have been proposed in the
paper. They have been illustrated for one impact category, with the help of a real
case study.
Range graphs represent the variable results of each system studied as clouds of
points. The sensitivity of the results to a parameter can be highlighted and the
amplitude of the variability can be visualized through the cloud shape. This
approach plays an important role in iterative LCA in defining priorities for data and
model refining. In case of comparative LCA, result differences between two systems can be plotted for all simulations, either against one parameter (delta graphs)
and by combining the variability of two parameters (areas of relevance).
Fig. 4 Ratio of GWP impacts between crates and boxes considering a combined variation of the
total logistic distance and the dimension of the cases. An index is visible for each simulation; it is
calculated as the ratio between the crate impact and the box impact
Visualizing the Effects of Parameter Variability …
349