

the energy consumption, which can have a detrimental effect on the accuracy of the
results. Numerical simulations have the advantage to not to require resources and
materials in order to be performed.
Average data are collected from literature reviews, customer statements or expert
knowledge. Compared to the previous kinds of data, average data are usually less
reliable and, in particular when only a few data are required to build a scenario, can
lead to an usage model very far from the actual one. However, this type of data is
very easy to gather and at low cost. Average scenario can also be built from the
meta-analysis of literature sources or from expert opinions.
2.2 Data Collected
In order to identify which data to collect for building usage scenarios for LCA and
sensitivity analysis, the important parameters that influence the environmental
footprint of the use phase must be identified (such as the technology, the accessories
including curtains, partition wall, etc., the setting from the end-user as the setting of
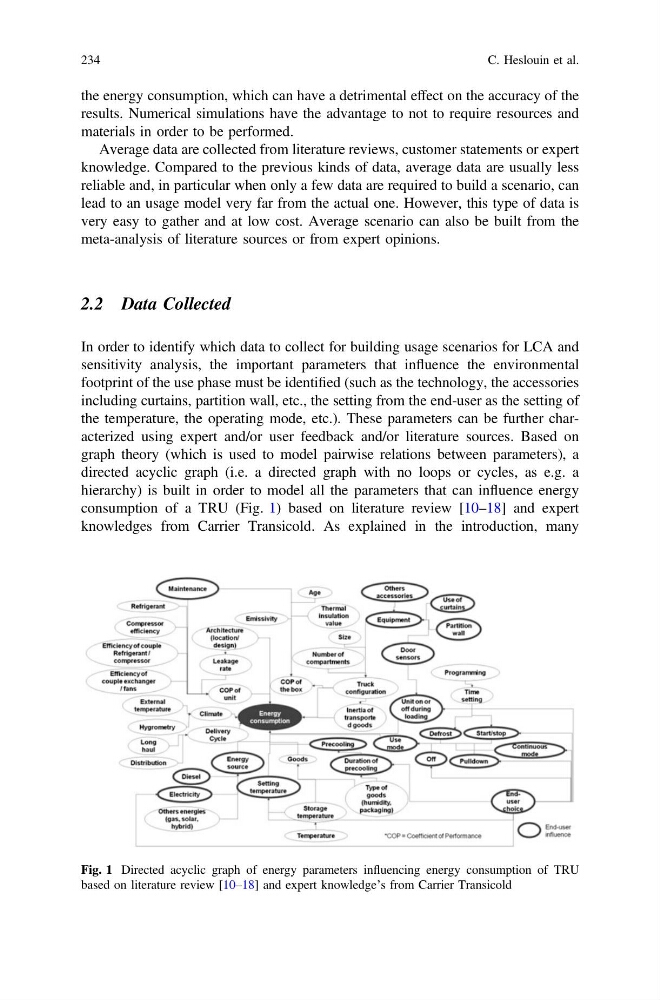
the temperature, the operating mode, etc.). These parameters can be further characterized using expert and/or user feedback and/or literature sources. Based on
graph theory (which is used to model pairwise relations between parameters), a
directed acyclic graph (i.e. a directed graph with no loops or cycles, as e.g. a
hierarchy) is built in order to model all the parameters that can influence energy
consumption of a TRU (Fig. 1) based on literature review [10–18] and expert
knowledges from Carrier Transicold. As explained in the introduction, many
Fig. 1 Directed acyclic graph of energy parameters influencing energy consumption of TRU
based on literature review [10–18] and expert knowledge’s from Carrier Transicold
234
C. Heslouin et al.
results. Numerical simulations have the advantage to not to require resources and
materials in order to be performed.
Average data are collected from literature reviews, customer statements or expert
knowledge. Compared to the previous kinds of data, average data are usually less
reliable and, in particular when only a few data are required to build a scenario, can
lead to an usage model very far from the actual one. However, this type of data is
very easy to gather and at low cost. Average scenario can also be built from the
meta-analysis of literature sources or from expert opinions.
2.2 Data Collected
In order to identify which data to collect for building usage scenarios for LCA and
sensitivity analysis, the important parameters that influence the environmental
footprint of the use phase must be identified (such as the technology, the accessories
including curtains, partition wall, etc., the setting from the end-user as the setting of
the temperature, the operating mode, etc.). These parameters can be further characterized using expert and/or user feedback and/or literature sources. Based on
graph theory (which is used to model pairwise relations between parameters), a
directed acyclic graph (i.e. a directed graph with no loops or cycles, as e.g. a
hierarchy) is built in order to model all the parameters that can influence energy
consumption of a TRU (Fig. 1) based on literature review [10–18] and expert
knowledges from Carrier Transicold. As explained in the introduction, many
Fig. 1 Directed acyclic graph of energy parameters influencing energy consumption of TRU
based on literature review [10–18] and expert knowledge’s from Carrier Transicold
234
C. Heslouin et al.