

186
3.1 The Determinants of Household Carbon Footprints
One of the most important factors determining the carbon footprint of Western
households is household income,
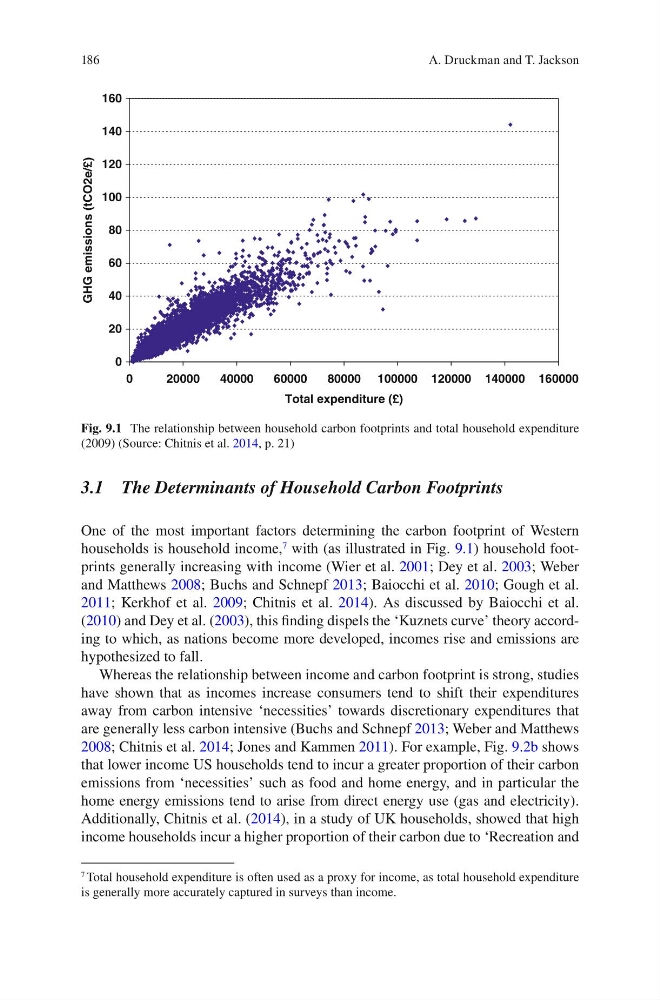
7 with (as illustrated in Fig. 9.1 ) household footprints generally increasing with income (Wier et al. 2001 ; Dey et al. 2003 ; Weber
and Matthews 2008 ; Buchs and Schnepf 2013 ; Baiocchi et al. 2010 ; Gough et al.
2011 ; Kerkhof et al. 2009 ; Chitnis et al. 2014 ). As discussed by Baiocchi et al.
( 2010 ) and Dey et al. ( 2003 ), this fi nding dispels the ‘Kuznets curve’ theory according to which, as nations become more developed, incomes rise and emissions are
hypothesized to fall.
Whereas the relationship between income and carbon footprint is strong, studies
have shown that as incomes increase consumers tend to shift their expenditures
away from carbon intensive ‘necessities’ towards discretionary expenditures that
are generally less carbon intensive (Buchs and Schnepf 2013 ; Weber and Matthews
2008 ; Chitnis et al. 2014 ; Jones and Kammen 2011 ). For example, Fig. 9.2b shows
that lower income US households tend to incur a greater proportion of their carbon
emissions from ‘necessities’ such as food and home energy, and in particular the
home energy emissions tend to arise from direct energy use (gas and electricity).
Additionally, Chitnis et al. ( 2014 ), in a study of UK households, showed that high
income households incur a higher proportion of their carbon due to ‘ Recreation and
7 Total household expenditure is often used as a proxy for income, as total household expenditure
is generally more accurately captured in surveys than income.
0
20
40
60
80
100
120
140
160
0
20000
40000
60000
80000 100000 120000 140000 160000
Total expenditure (£)
GHG emissions (tCO2e/£)
Fig. 9.1 The relationship between household carbon footprints and total household expenditure
(2009) (Source: Chitnis et al. 2014 , p. 21)
A. Druckman and T. Jackson
3.1 The Determinants of Household Carbon Footprints
One of the most important factors determining the carbon footprint of Western
households is household income,
7 with (as illustrated in Fig. 9.1 ) household footprints generally increasing with income (Wier et al. 2001 ; Dey et al. 2003 ; Weber
and Matthews 2008 ; Buchs and Schnepf 2013 ; Baiocchi et al. 2010 ; Gough et al.
2011 ; Kerkhof et al. 2009 ; Chitnis et al. 2014 ). As discussed by Baiocchi et al.
( 2010 ) and Dey et al. ( 2003 ), this fi nding dispels the ‘Kuznets curve’ theory according to which, as nations become more developed, incomes rise and emissions are
hypothesized to fall.
Whereas the relationship between income and carbon footprint is strong, studies
have shown that as incomes increase consumers tend to shift their expenditures
away from carbon intensive ‘necessities’ towards discretionary expenditures that
are generally less carbon intensive (Buchs and Schnepf 2013 ; Weber and Matthews
2008 ; Chitnis et al. 2014 ; Jones and Kammen 2011 ). For example, Fig. 9.2b shows
that lower income US households tend to incur a greater proportion of their carbon
emissions from ‘necessities’ such as food and home energy, and in particular the
home energy emissions tend to arise from direct energy use (gas and electricity).
Additionally, Chitnis et al. ( 2014 ), in a study of UK households, showed that high
income households incur a higher proportion of their carbon due to ‘ Recreation and
7 Total household expenditure is often used as a proxy for income, as total household expenditure
is generally more accurately captured in surveys than income.
0
20
40
60
80
100
120
140
160
0
20000
40000
60000
80000 100000 120000 140000 160000
Total expenditure (£)
GHG emissions (tCO2e/£)
Fig. 9.1 The relationship between household carbon footprints and total household expenditure
(2009) (Source: Chitnis et al. 2014 , p. 21)
A. Druckman and T. Jackson