

161
are malnourished has fallen by a third’ (WRI 2014 ). At the same time, pressures on
the natural environment have increased tremendously: ‘Every minute of every day
we have been losing the equivalent of 50 soccer fi elds of forest. Over one billion
people already face water scarcity, and this may triple by 2025. Climate change is
costing $700 billion per year, with the greatest impact on the poor’ (WRI 2014 ).
The sheer amount of goods shipped around the world is also unprecedented. Ten
billion tonnes (10 gigatons, Gt) of materials and products were shipped between
countries in 2005 (Dittrich and Bringezu 2010 ). And this fi gure includes only the
direct physical trade, i.e. actual shipment of materials and goods. As will be shown
later in this chapter, raw materials are also extracted and processed in order to enable
exports, even though they never leave the country. Adding these indirect material
fl ows or ‘raw material equivalents’ to the actual physical trade resulted in a total
amount of 29 Gt of materials associated with trade fl ows between countries in 2008
(Wiedmann et al. 2015 ).
In addition to growing in scale, trade has become more complex and fragmented.
The production process of many products occurs in small stages in different countries, interlinked through complex global supply chain networks. Supply chains
have become longer, more fragmented and more complex. World merchandise
exports of intermediate and fi nal products were almost identical in 1993 (7–8 % of
world GDP ), but exports of intermediate exports have grown faster since and were
15 % of GDP in 2012, whilst exports of fi nal goods only reached 11 % of GDP.
Longer and more fragmented supply chains also mean that places of production
and consumption are more separated and that it becomes more diffi cult to establish
the link between environmental impacts exerted by the production process and the
fi nal destination of the product. In other words, the ‘cradle-to-gate’ life cycle
becomes longer, more convoluted and more diffi cult to assess. Increasingly sophisticated global models have had to be developed to evaluate impacts embodied in
global supply chains (Tukker and Dietzenbacher 2013 ; Wiedmann 2009 ; Wiedmann
et al. 2007 , 2011 ).
0
20
40
60
80
100
120
140
160
180
200
Total
exports
by value
Total
exports
by
volume
GDP
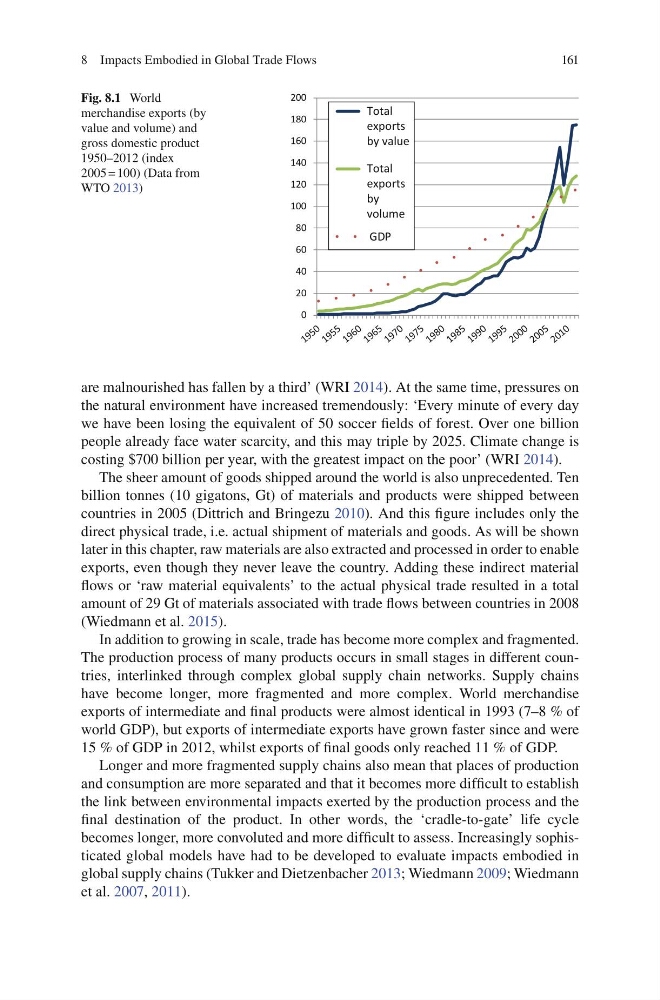
Fig. 8.1 World
merchandise exports (by
value and volume) and
gross domestic product
1950–2012 (index
2005 = 100) (Data from
WTO 2013 )
8 Impacts Embodied in Global Trade Flows
are malnourished has fallen by a third’ (WRI 2014 ). At the same time, pressures on
the natural environment have increased tremendously: ‘Every minute of every day
we have been losing the equivalent of 50 soccer fi elds of forest. Over one billion
people already face water scarcity, and this may triple by 2025. Climate change is
costing $700 billion per year, with the greatest impact on the poor’ (WRI 2014 ).
The sheer amount of goods shipped around the world is also unprecedented. Ten
billion tonnes (10 gigatons, Gt) of materials and products were shipped between
countries in 2005 (Dittrich and Bringezu 2010 ). And this fi gure includes only the
direct physical trade, i.e. actual shipment of materials and goods. As will be shown
later in this chapter, raw materials are also extracted and processed in order to enable
exports, even though they never leave the country. Adding these indirect material
fl ows or ‘raw material equivalents’ to the actual physical trade resulted in a total
amount of 29 Gt of materials associated with trade fl ows between countries in 2008
(Wiedmann et al. 2015 ).
In addition to growing in scale, trade has become more complex and fragmented.
The production process of many products occurs in small stages in different countries, interlinked through complex global supply chain networks. Supply chains
have become longer, more fragmented and more complex. World merchandise
exports of intermediate and fi nal products were almost identical in 1993 (7–8 % of
world GDP ), but exports of intermediate exports have grown faster since and were
15 % of GDP in 2012, whilst exports of fi nal goods only reached 11 % of GDP.
Longer and more fragmented supply chains also mean that places of production
and consumption are more separated and that it becomes more diffi cult to establish
the link between environmental impacts exerted by the production process and the
fi nal destination of the product. In other words, the ‘cradle-to-gate’ life cycle
becomes longer, more convoluted and more diffi cult to assess. Increasingly sophisticated global models have had to be developed to evaluate impacts embodied in
global supply chains (Tukker and Dietzenbacher 2013 ; Wiedmann 2009 ; Wiedmann
et al. 2007 , 2011 ).
0
20
40
60
80
100
120
140
160
180
200
Total
exports
by value
Total
exports
by
volume
GDP
Fig. 8.1 World
merchandise exports (by
value and volume) and
gross domestic product
1950–2012 (index
2005 = 100) (Data from
WTO 2013 )
8 Impacts Embodied in Global Trade Flows