

72
C Calibration
0.5
1
1.5
2
expt
(sec)
10
-3
5
10
15
20
DSIM
(MC step)
DSIM
= c
expt
c = 1.18 10
4
R
2 = 0.9265
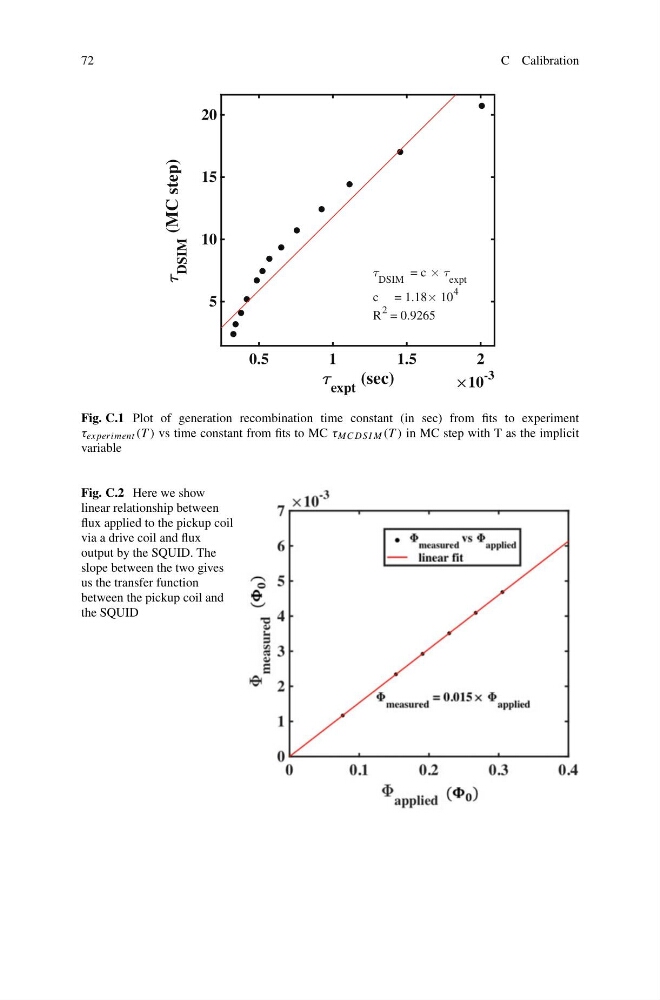
Fig. C.1 Plot of generation recombination time constant (in sec) from fits to experiment
τ experiment (T ) vs time constant from fits to MC τ MCDSI M (T ) in MC step with T as the implicit
variable
Fig. C.2 Here we show
linear relationship between
flux applied to the pickup coil
via a drive coil and flux
output by the SQUID. The
slope between the two gives
us the transfer function
between the pickup coil and
the SQUID
C Calibration
0.5
1
1.5
2
expt
(sec)
10
-3
5
10
15
20
DSIM
(MC step)
DSIM
= c
expt
c = 1.18 10
4
R
2 = 0.9265
Fig. C.1 Plot of generation recombination time constant (in sec) from fits to experiment
τ experiment (T ) vs time constant from fits to MC τ MCDSI M (T ) in MC step with T as the implicit
variable
Fig. C.2 Here we show
linear relationship between
flux applied to the pickup coil
via a drive coil and flux
output by the SQUID. The
slope between the two gives
us the transfer function
between the pickup coil and
the SQUID