

Appendix B
Dy 2 Ti 2 O 7 Flux Noise Features
B.1 Signal Strength
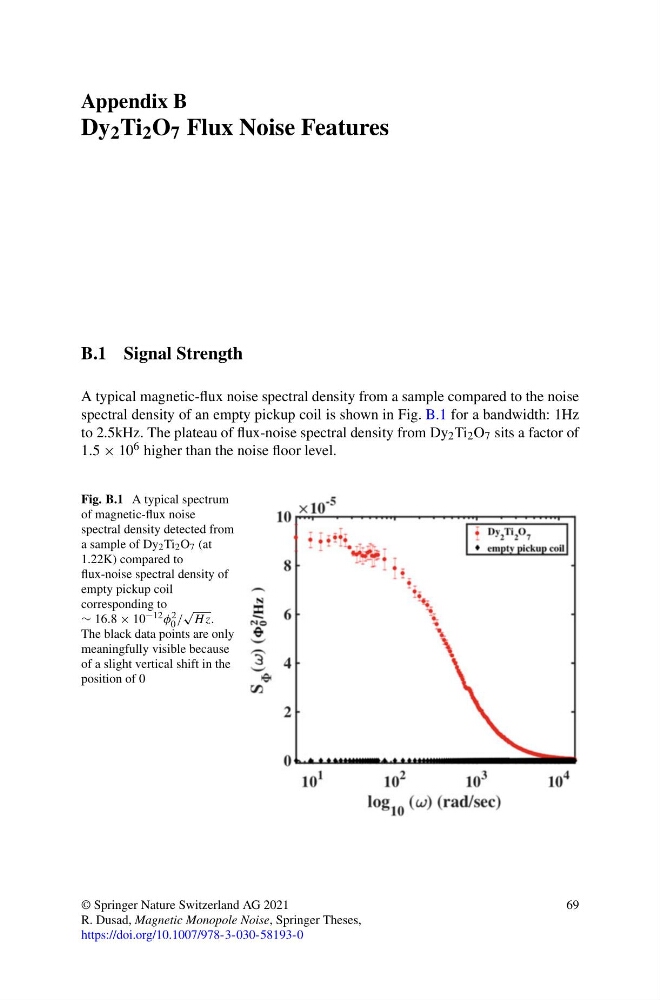
A typical magnetic-flux noise spectral density from a sample compared to the noise
spectral density of an empty pickup coil is shown in Fig. B.1 for a bandwidth: 1Hz
to 2.5kHz. The plateau of flux-noise spectral density from Dy 2 Ti 2 O 7 sits a factor of
1.5 × 10 6 higher than the noise floor level.
Fig. B.1 A typical spectrum
of magnetic-flux noise
spectral density detected from
a sample of Dy 2 Ti 2 O 7 (at
1.22K) compared to
flux-noise spectral density of
empty pickup coil
corresponding to
∼ 16.8 × 10 −12 φ 2
0 /
√
H z.
The black data points are only
meaningfully visible because
of a slight vertical shift in the
position of 0
© Springer Nature Switzerland AG 2021
R. Dusad, Magnetic Monopole Noise, Springer Theses,
https://doi.org/10.1007/978-3-030-58193-0
69
Dy 2 Ti 2 O 7 Flux Noise Features
B.1 Signal Strength
A typical magnetic-flux noise spectral density from a sample compared to the noise
spectral density of an empty pickup coil is shown in Fig. B.1 for a bandwidth: 1Hz
to 2.5kHz. The plateau of flux-noise spectral density from Dy 2 Ti 2 O 7 sits a factor of
1.5 × 10 6 higher than the noise floor level.
Fig. B.1 A typical spectrum
of magnetic-flux noise
spectral density detected from
a sample of Dy 2 Ti 2 O 7 (at
1.22K) compared to
flux-noise spectral density of
empty pickup coil
corresponding to
∼ 16.8 × 10 −12 φ 2
0 /
√
H z.
The black data points are only
meaningfully visible because
of a slight vertical shift in the
position of 0
© Springer Nature Switzerland AG 2021
R. Dusad, Magnetic Monopole Noise, Springer Theses,
https://doi.org/10.1007/978-3-030-58193-0
69