

6
1 Introduction
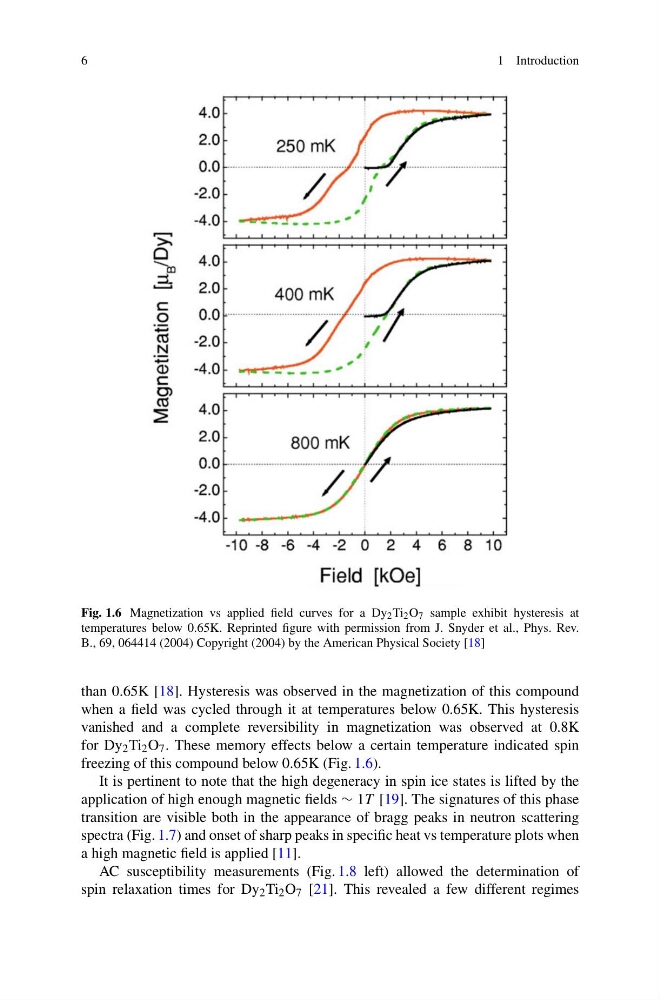
Fig. 1.6 Magnetization vs applied field curves for a Dy 2 Ti 2 O 7 sample exhibit hysteresis at
temperatures below 0.65K. Reprinted figure with permission from J. Snyder et al., Phys. Rev.
B., 69, 064414 (2004) Copyright (2004) by the American Physical Society [18]
than 0.65K [18]. Hysteresis was observed in the magnetization of this compound
when a field was cycled through it at temperatures below 0.65K. This hysteresis
vanished and a complete reversibility in magnetization was observed at 0.8K
for Dy 2 Ti 2 O 7 . These memory effects below a certain temperature indicated spin
freezing of this compound below 0.65K (Fig. 1.6).
It is pertinent to note that the high degeneracy in spin ice states is lifted by the
application of high enough magnetic fields ∼ 1T [19]. The signatures of this phase
transition are visible both in the appearance of bragg peaks in neutron scattering
spectra (Fig. 1.7) and onset of sharp peaks in specific heat vs temperature plots when
a high magnetic field is applied [11].
AC susceptibility measurements (Fig. 1.8 left) allowed the determination of
spin relaxation times for Dy 2 Ti 2 O 7 [21]. This revealed a few different regimes
1 Introduction
Fig. 1.6 Magnetization vs applied field curves for a Dy 2 Ti 2 O 7 sample exhibit hysteresis at
temperatures below 0.65K. Reprinted figure with permission from J. Snyder et al., Phys. Rev.
B., 69, 064414 (2004) Copyright (2004) by the American Physical Society [18]
than 0.65K [18]. Hysteresis was observed in the magnetization of this compound
when a field was cycled through it at temperatures below 0.65K. This hysteresis
vanished and a complete reversibility in magnetization was observed at 0.8K
for Dy 2 Ti 2 O 7 . These memory effects below a certain temperature indicated spin
freezing of this compound below 0.65K (Fig. 1.6).
It is pertinent to note that the high degeneracy in spin ice states is lifted by the
application of high enough magnetic fields ∼ 1T [19]. The signatures of this phase
transition are visible both in the appearance of bragg peaks in neutron scattering
spectra (Fig. 1.7) and onset of sharp peaks in specific heat vs temperature plots when
a high magnetic field is applied [11].
AC susceptibility measurements (Fig. 1.8 left) allowed the determination of
spin relaxation times for Dy 2 Ti 2 O 7 [21]. This revealed a few different regimes