

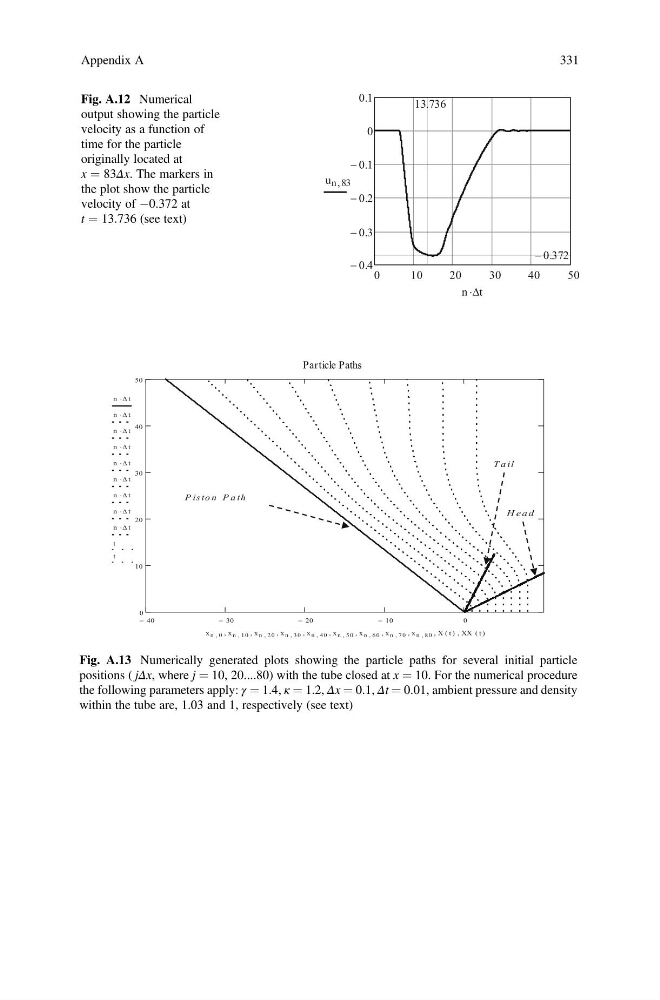
Fig. A.12 Numerical
output showing the particle
velocity as a function of
time for the particle
originally located at
x ¼ 83Δx. The markers in
the plot show the particle
velocity of À0.372 at
t ¼ 13.736 (see text)
Fig. A.13 Numerically generated plots showing the particle paths for several initial particle
positions ( jΔx, where j ¼ 10, 20....80) with the tube closed at x ¼ 10. For the numerical procedure
the following parameters apply: γ ¼ 1.4, κ ¼ 1.2, Δx ¼ 0.1, Δt ¼ 0.01, ambient pressure and density
within the tube are, 1.03 and 1, respectively (see text)
Appendix A
331
output showing the particle
velocity as a function of
time for the particle
originally located at
x ¼ 83Δx. The markers in
the plot show the particle
velocity of À0.372 at
t ¼ 13.736 (see text)
Fig. A.13 Numerically generated plots showing the particle paths for several initial particle
positions ( jΔx, where j ¼ 10, 20....80) with the tube closed at x ¼ 10. For the numerical procedure
the following parameters apply: γ ¼ 1.4, κ ¼ 1.2, Δx ¼ 0.1, Δt ¼ 0.01, ambient pressure and density
within the tube are, 1.03 and 1, respectively (see text)
Appendix A
331