

shown in Fig. 6.18 the profile resembles the pressure profile and shows a reversal in
the air flow towards the centre corresponding to the onset of the suction-phase as
previously noted in the case of the pressure profile. This suction-phase is shown in
Fig. 6.19 at much later times during the expansion.
Normalized Radius
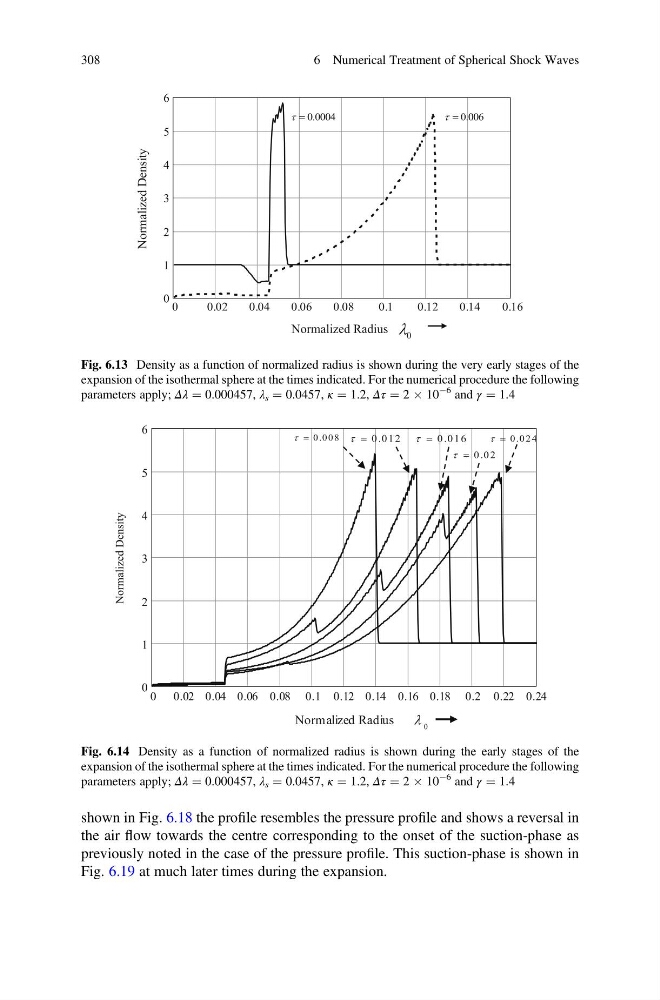
Fig. 6.13 Density as a function of normalized radius is shown during the very early stages of the
expansion of the isothermal sphere at the times indicated. For the numerical procedure the following
parameters apply; Δλ ¼ 0.000457, λ s ¼ 0.0457, κ ¼ 1.2, Δτ ¼ 2 Â 10
À6 and γ ¼ 1.4
Normalized Density
Fig. 6.14 Density as a function of normalized radius is shown during the early stages of the
expansion of the isothermal sphere at the times indicated. For the numerical procedure the following
parameters apply; Δλ ¼ 0.000457, λ s ¼ 0.0457, κ ¼ 1.2, Δτ ¼ 2 Â 10
À6 and γ ¼ 1.4
308
6 Numerical Treatment of Spherical Shock Waves
the air flow towards the centre corresponding to the onset of the suction-phase as
previously noted in the case of the pressure profile. This suction-phase is shown in
Fig. 6.19 at much later times during the expansion.
Normalized Radius
Fig. 6.13 Density as a function of normalized radius is shown during the very early stages of the
expansion of the isothermal sphere at the times indicated. For the numerical procedure the following
parameters apply; Δλ ¼ 0.000457, λ s ¼ 0.0457, κ ¼ 1.2, Δτ ¼ 2 Â 10
À6 and γ ¼ 1.4
Normalized Density
Fig. 6.14 Density as a function of normalized radius is shown during the early stages of the
expansion of the isothermal sphere at the times indicated. For the numerical procedure the following
parameters apply; Δλ ¼ 0.000457, λ s ¼ 0.0457, κ ¼ 1.2, Δτ ¼ 2 Â 10
À6 and γ ¼ 1.4
308
6 Numerical Treatment of Spherical Shock Waves