

An Automatic Sound ClassifiCation Framework …
429
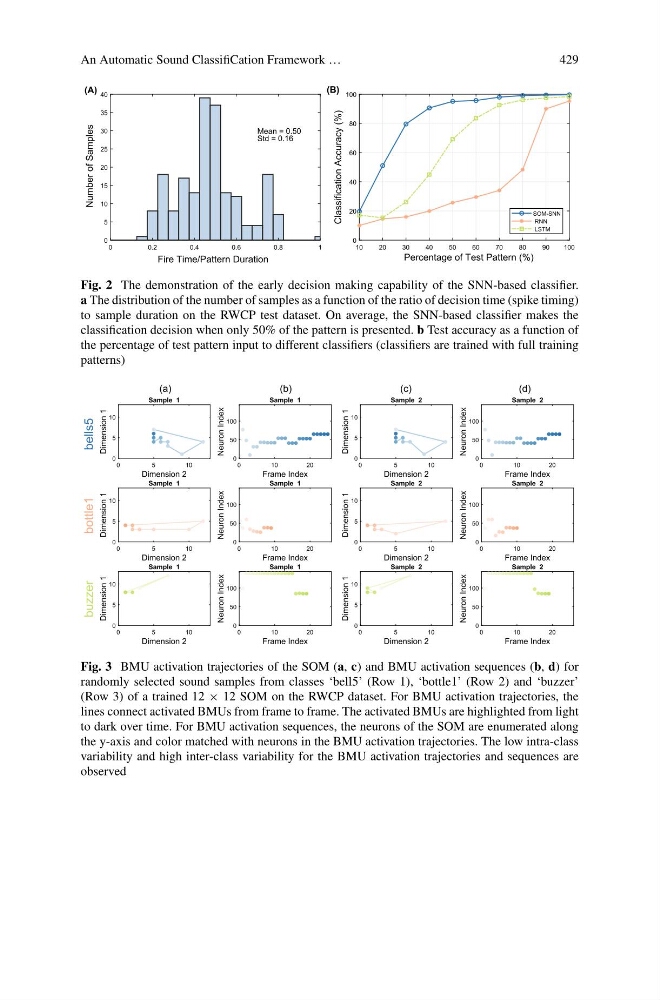
Fig. 2 The demonstration of the early decision making capability of the SNN-based classifier.
a The distribution of the number of samples as a function of the ratio of decision time (spike timing)
to sample duration on the RWCP test dataset. On average, the SNN-based classifier makes the
classification decision when only 50% of the pattern is presented. b Test accuracy as a function of
the percentage of test pattern input to different classifiers (classifiers are trained with full training
patterns)
Fig. 3 BMU activation trajectories of the SOM (a, c) and BMU activation sequences (b, d) for
randomly selected sound samples from classes ‘bell5’ (Row 1), ‘bottle1’ (Row 2) and ‘buzzer’
(Row 3) of a trained 12 × 12 SOM on the RWCP dataset. For BMU activation trajectories, the
lines connect activated BMUs from frame to frame. The activated BMUs are highlighted from light
to dark over time. For BMU activation sequences, the neurons of the SOM are enumerated along
the y-axis and color matched with neurons in the BMU activation trajectories. The low intra-class
variability and high inter-class variability for the BMU activation trajectories and sequences are
observed
429
Fig. 2 The demonstration of the early decision making capability of the SNN-based classifier.
a The distribution of the number of samples as a function of the ratio of decision time (spike timing)
to sample duration on the RWCP test dataset. On average, the SNN-based classifier makes the
classification decision when only 50% of the pattern is presented. b Test accuracy as a function of
the percentage of test pattern input to different classifiers (classifiers are trained with full training
patterns)
Fig. 3 BMU activation trajectories of the SOM (a, c) and BMU activation sequences (b, d) for
randomly selected sound samples from classes ‘bell5’ (Row 1), ‘bottle1’ (Row 2) and ‘buzzer’
(Row 3) of a trained 12 × 12 SOM on the RWCP dataset. For BMU activation trajectories, the
lines connect activated BMUs from frame to frame. The activated BMUs are highlighted from light
to dark over time. For BMU activation sequences, the neurons of the SOM are enumerated along
the y-axis and color matched with neurons in the BMU activation trajectories. The low intra-class
variability and high inter-class variability for the BMU activation trajectories and sequences are
observed