

51
of the exponential decrease ranges from 0.005 nm
−1
to
0.031 nm
−1
(Brewin et al. 2015; Bricaud et al. 2012; Chen
et al. 2017) and the reference is usually set to an available
blue wavelength (440 nm).
In case-2 waters, Stedmon et al. (2000) and Kowalczuk
et al. (2006) analyzed CDOM in Danish coastal waters and
in the Baltic Sea and found a dependency on the origination
of CDOM and seasonal stratification, respectively. This
shows the complexity of case-2 waters. Bricaud et al. (1995)
and Bricaud et al. (1998) found an empirical equation for
chlorophyll concentration and absorption with spectral
dependent coefficients A [m
3
mg
−1
] and B [dl] in open
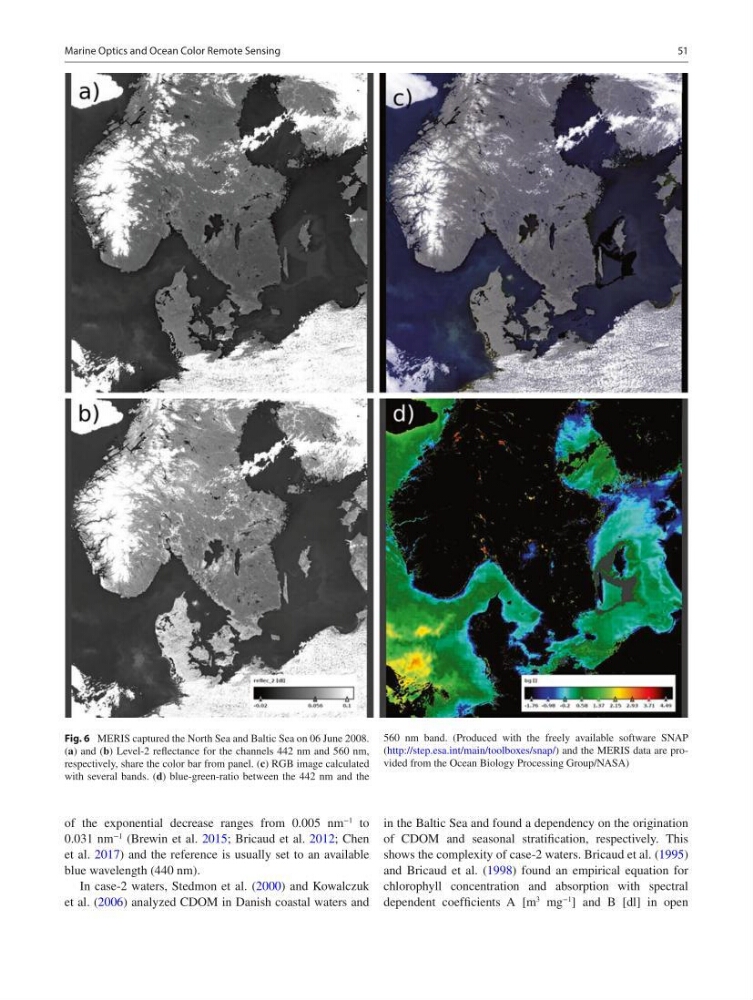
Fig. 6 MERIS captured the North Sea and Baltic Sea on 06 June 2008.
(a) and (b) Level-2 reflectance for the channels 442 nm and 560 nm,
respectively, share the color bar from panel. (c) RGB image calculated
with several bands. (d) blue-green-ratio between the 442 nm and the
560 nm band. (Produced with the freely available software SNAP
(http://step.esa.int/main/toolboxes/snap/) and the MERIS data are provided from the Ocean Biology Processing Group/NASA)
Marine Optics and Ocean Color Remote Sensing
of the exponential decrease ranges from 0.005 nm
−1
to
0.031 nm
−1
(Brewin et al. 2015; Bricaud et al. 2012; Chen
et al. 2017) and the reference is usually set to an available
blue wavelength (440 nm).
In case-2 waters, Stedmon et al. (2000) and Kowalczuk
et al. (2006) analyzed CDOM in Danish coastal waters and
in the Baltic Sea and found a dependency on the origination
of CDOM and seasonal stratification, respectively. This
shows the complexity of case-2 waters. Bricaud et al. (1995)
and Bricaud et al. (1998) found an empirical equation for
chlorophyll concentration and absorption with spectral
dependent coefficients A [m
3
mg
−1
] and B [dl] in open
Fig. 6 MERIS captured the North Sea and Baltic Sea on 06 June 2008.
(a) and (b) Level-2 reflectance for the channels 442 nm and 560 nm,
respectively, share the color bar from panel. (c) RGB image calculated
with several bands. (d) blue-green-ratio between the 442 nm and the
560 nm band. (Produced with the freely available software SNAP
(http://step.esa.int/main/toolboxes/snap/) and the MERIS data are provided from the Ocean Biology Processing Group/NASA)
Marine Optics and Ocean Color Remote Sensing