

187
When combining EDX with scanning electron microscopy (SEM), this technique can provide information on the
elemental composition of a particle and therefore distinguish
plastics from inorganic materials (Eriksen et al. 2013;
Vianello et al. 2013; Ivleva et al. 2016; Wagner et al. 2017;
Wang et al. 2017). The identification of different plastic
types is limited and therefore this method is recommended to
be used for surface characterization and visualization additional to previous FTIR analysis (Vianello et al. 2013; Shim
et al. 2017). FTIR analysis is a vibrational spectroscopic
technique based on infrared radiation that excites molecular
bonds resulting in vibrations that can be detected and transferred into characteristic absorbance spectra. These spectra
can further be compared to a database of reference spectra
allowing for the reliable identification of different polymer
types. FTIR spectroscopy can be used in different modes,
namely transmission (Löder et al. 2015; Käppler et al. 2016;
Mintenig et al. 2017; Primpke et al. 2017b), reflection
(Harrison et al. 2012; Vianello et al. 2013; Tagg et al. 2015)
and attenuated total-reflectance (ATR) (Song et al. 2015;
Käppler et al. 2016; Crichton et al. 2017; Imhof et al. 2017;
Wagner et al. 2017). To measure very small particles FTIR
spectroscopy can be coupled to microscopy (μFTIR) and be
used in all three modes as well (Ivleva et al. 2016; Shim et al.
2017). All these modes have several advantages and limitations. While the transmission mode provides high quality
spectra it is restricted to a certain thickness of material to
allow infrared radiation to pass through the sample without
being fully absorbed (Löder and Gerdts 2015; Ivleva et al.
2016). Reflectance mode on the other hand provides spectra
of thick and opaque particles but does depend on the surface
properties since uneven surfaces can cause scattering effects
which cause refractive errors (Löder and Gerdts 2015; Shim
et al. 2017). High quality spectra can be achieved by μATRFTIR with the disadvantage of potentially damaging particles since a crystal has to be pressed on the sample (Ivleva
et al. 2016; Shim et al. 2017). Another vibrational spectroscopy, that is complementary to FTIR, is Raman spectroscopy
(Käppler et al. 2016). Monochromatic light, usually provided
by a laser, irradiates the sample and vibrations are resulting
in a Raman shift, which can be presented as substance characteristic spectra (Ivleva et al. 2016; Shim et al. 2017).
Raman micro-spectrometry has successfully been used to
identify MPs in environmental samples (Enders et al. 2015;
Fischer et al. 2015; Frère et al. 2016; Imhof et al. 2016;
Wagner et al. 2017). For thermal analysis, pyrolysis-gas
chromatography-mass spectrometry (Pyr-GC-MS) and thermoextraction and desorption (TED) coupled with GC-MS
are the most prevalent and promising ones (Fries et al. 2013;
Dümichen et al. 2015; Fischer and Scholz-Böttcher 2017).
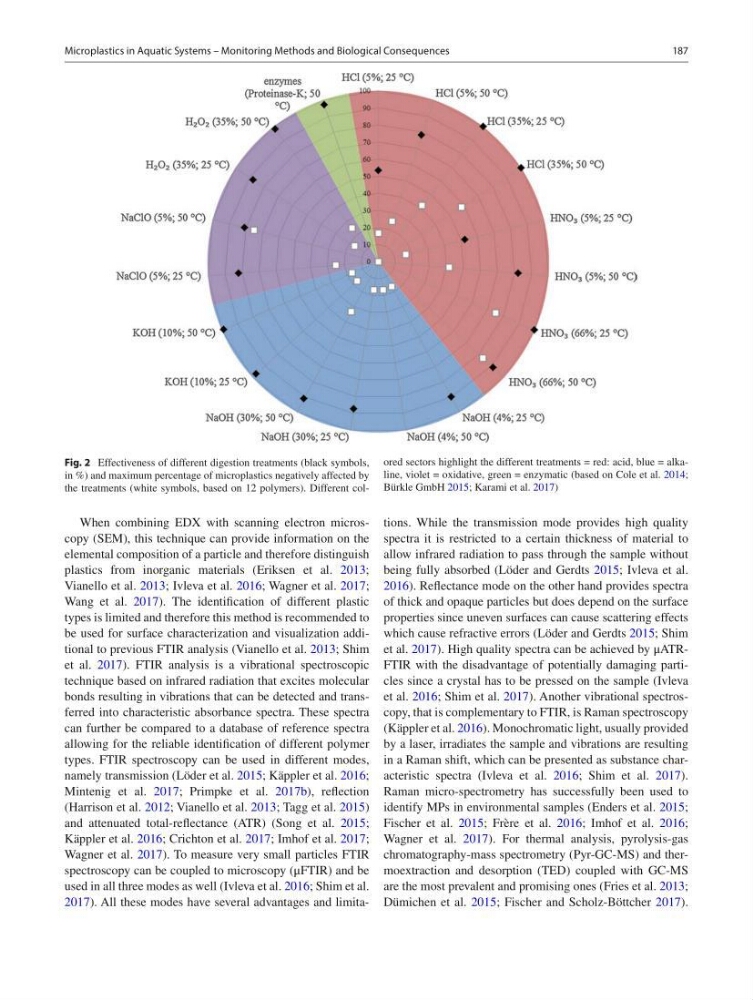
Fig. 2 Effectiveness of different digestion treatments (black symbols,
in %) and maximum percentage of microplastics negatively affected by
the treatments (white symbols, based on 12 polymers). Different colored sectors highlight the different treatments = red: acid, blue = alkaline, violet = oxidative, green = enzymatic (based on Cole et al. 2014;
Bürkle GmbH 2015; Karami et al. 2017)
Microplastics in Aquatic Systems – Monitoring Methods and Biological Consequences
When combining EDX with scanning electron microscopy (SEM), this technique can provide information on the
elemental composition of a particle and therefore distinguish
plastics from inorganic materials (Eriksen et al. 2013;
Vianello et al. 2013; Ivleva et al. 2016; Wagner et al. 2017;
Wang et al. 2017). The identification of different plastic
types is limited and therefore this method is recommended to
be used for surface characterization and visualization additional to previous FTIR analysis (Vianello et al. 2013; Shim
et al. 2017). FTIR analysis is a vibrational spectroscopic
technique based on infrared radiation that excites molecular
bonds resulting in vibrations that can be detected and transferred into characteristic absorbance spectra. These spectra
can further be compared to a database of reference spectra
allowing for the reliable identification of different polymer
types. FTIR spectroscopy can be used in different modes,
namely transmission (Löder et al. 2015; Käppler et al. 2016;
Mintenig et al. 2017; Primpke et al. 2017b), reflection
(Harrison et al. 2012; Vianello et al. 2013; Tagg et al. 2015)
and attenuated total-reflectance (ATR) (Song et al. 2015;
Käppler et al. 2016; Crichton et al. 2017; Imhof et al. 2017;
Wagner et al. 2017). To measure very small particles FTIR
spectroscopy can be coupled to microscopy (μFTIR) and be
used in all three modes as well (Ivleva et al. 2016; Shim et al.
2017). All these modes have several advantages and limitations. While the transmission mode provides high quality
spectra it is restricted to a certain thickness of material to
allow infrared radiation to pass through the sample without
being fully absorbed (Löder and Gerdts 2015; Ivleva et al.
2016). Reflectance mode on the other hand provides spectra
of thick and opaque particles but does depend on the surface
properties since uneven surfaces can cause scattering effects
which cause refractive errors (Löder and Gerdts 2015; Shim
et al. 2017). High quality spectra can be achieved by μATRFTIR with the disadvantage of potentially damaging particles since a crystal has to be pressed on the sample (Ivleva
et al. 2016; Shim et al. 2017). Another vibrational spectroscopy, that is complementary to FTIR, is Raman spectroscopy
(Käppler et al. 2016). Monochromatic light, usually provided
by a laser, irradiates the sample and vibrations are resulting
in a Raman shift, which can be presented as substance characteristic spectra (Ivleva et al. 2016; Shim et al. 2017).
Raman micro-spectrometry has successfully been used to
identify MPs in environmental samples (Enders et al. 2015;
Fischer et al. 2015; Frère et al. 2016; Imhof et al. 2016;
Wagner et al. 2017). For thermal analysis, pyrolysis-gas
chromatography-mass spectrometry (Pyr-GC-MS) and thermoextraction and desorption (TED) coupled with GC-MS
are the most prevalent and promising ones (Fries et al. 2013;
Dümichen et al. 2015; Fischer and Scholz-Böttcher 2017).
Fig. 2 Effectiveness of different digestion treatments (black symbols,
in %) and maximum percentage of microplastics negatively affected by
the treatments (white symbols, based on 12 polymers). Different colored sectors highlight the different treatments = red: acid, blue = alkaline, violet = oxidative, green = enzymatic (based on Cole et al. 2014;
Bürkle GmbH 2015; Karami et al. 2017)
Microplastics in Aquatic Systems – Monitoring Methods and Biological Consequences