

2.4 Identifying Particle Decays with Jet Substructure
45
struction can be used for q/g separation [259], W , Z , H and t tagging. Including
all jet constituents is computationally unfeasible due to the large number of possible
shower histories. In practice, the jet is reclustered into small subjets with R around
0.2 and only the leading 8–10 subjets are considered for { p N }.
The Metric Space of Collider Events
Inspired by the question of when two collider events are similar, a theoretically and
experimentally robust definition of a distance between two events has been defined
as the energy mover’s distance (EMD) [260]. The EMD((, ,
) is the minimum work
required to rearrange an event into another
by movements of energy from a particle in one event into a particle in the other event. This approach can be applied to
the substructure of jets, where the metric space between jets can be used to classify
jets without requiring specially designed observables. Instead, the nearest neighbours in the metric space determine the class membership of a given jet [261]. This
approach can be used for jet tagging, with comparable sensitivity to machine learning
techniques [260]. In addition, this opens the possibility for unsupervised anomaly
detection, where jets with the largest distance to the rest of the dataset are the most
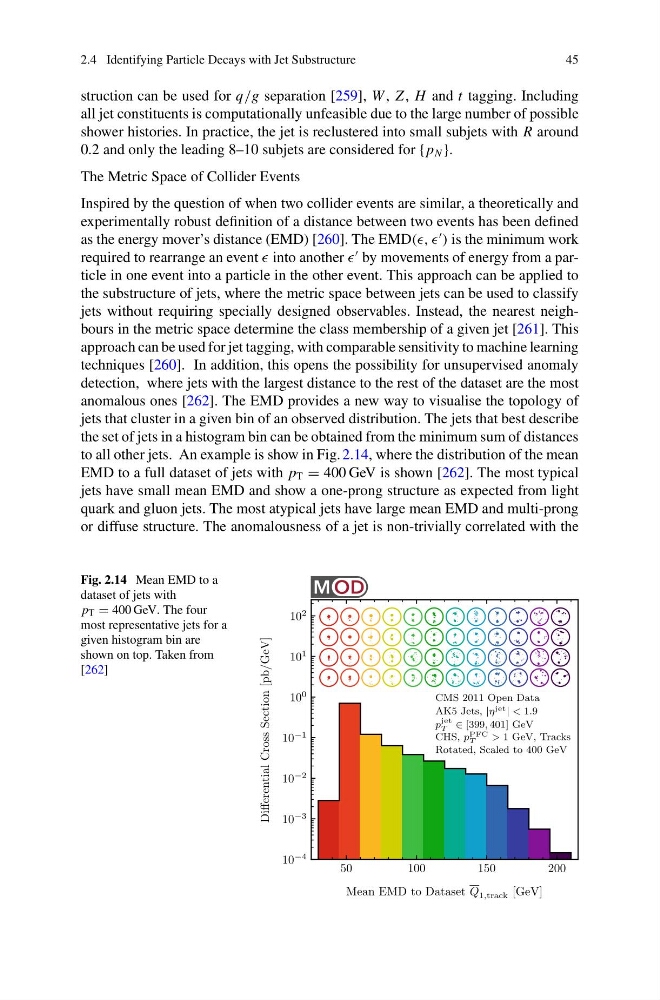
anomalous ones [262]. The EMD provides a new way to visualise the topology of
jets that cluster in a given bin of an observed distribution. The jets that best describe
the set of jets in a histogram bin can be obtained from the minimum sum of distances
to all other jets. An example is show in Fig. 2.14, where the distribution of the mean
EMD to a full dataset of jets with p T = 400 GeV is shown [262]. The most typical
jets have small mean EMD and show a one-prong structure as expected from light
quark and gluon jets. The most atypical jets have large mean EMD and multi-prong
or diffuse structure. The anomalousness of a jet is non-trivially correlated with the
Fig. 2.14 Mean EMD to a
dataset of jets with
p T = 400 GeV. The four
most representative jets for a
given histogram bin are
shown on top. Taken from
[262]
50
100
150
200
Mean EMD to Dataset Q 1,track [GeV]
10
−4
10
−3
10
−2
10
−1
10
0
10
1
10
2
Differential Cross Section [pb/GeV]
CMS 2011 Open Data
AK5 Jets, |η
jet | < 1.9
p
jet
T ∈ [399, 401] GeV
CHS, p
PFC
T
> 1 GeV, Tracks
Rotated, Scaled to 400 GeV
45
struction can be used for q/g separation [259], W , Z , H and t tagging. Including
all jet constituents is computationally unfeasible due to the large number of possible
shower histories. In practice, the jet is reclustered into small subjets with R around
0.2 and only the leading 8–10 subjets are considered for { p N }.
The Metric Space of Collider Events
Inspired by the question of when two collider events are similar, a theoretically and
experimentally robust definition of a distance between two events has been defined
as the energy mover’s distance (EMD) [260]. The EMD((, ,
) is the minimum work
required to rearrange an event into another
by movements of energy from a particle in one event into a particle in the other event. This approach can be applied to
the substructure of jets, where the metric space between jets can be used to classify
jets without requiring specially designed observables. Instead, the nearest neighbours in the metric space determine the class membership of a given jet [261]. This
approach can be used for jet tagging, with comparable sensitivity to machine learning
techniques [260]. In addition, this opens the possibility for unsupervised anomaly
detection, where jets with the largest distance to the rest of the dataset are the most
anomalous ones [262]. The EMD provides a new way to visualise the topology of
jets that cluster in a given bin of an observed distribution. The jets that best describe
the set of jets in a histogram bin can be obtained from the minimum sum of distances
to all other jets. An example is show in Fig. 2.14, where the distribution of the mean
EMD to a full dataset of jets with p T = 400 GeV is shown [262]. The most typical
jets have small mean EMD and show a one-prong structure as expected from light
quark and gluon jets. The most atypical jets have large mean EMD and multi-prong
or diffuse structure. The anomalousness of a jet is non-trivially correlated with the
Fig. 2.14 Mean EMD to a
dataset of jets with
p T = 400 GeV. The four
most representative jets for a
given histogram bin are
shown on top. Taken from
[262]
50
100
150
200
Mean EMD to Dataset Q 1,track [GeV]
10
−4
10
−3
10
−2
10
−1
10
0
10
1
10
2
Differential Cross Section [pb/GeV]
CMS 2011 Open Data
AK5 Jets, |η
jet | < 1.9
p
jet
T ∈ [399, 401] GeV
CHS, p
PFC
T
> 1 GeV, Tracks
Rotated, Scaled to 400 GeV