

2.2 General Considerations
23
be modelled by two consecutive two-body decays, where the polarisation states of
the top quark and the W boson need to be taken into account.
At the LHC, tt production results in unpolarised top quarks, which leads to a
uniform decay distribution in the decay angle in the CM frame. This transforms into
a uniform energy distribution of the b quarks and W bosons in the laboratory rest
frame, for mono-energetic top quarks. The minimum and maximum energies are
obtained for θ
∗
= 0 or π , thus the distributions of the b quark and W boson energies,
E b and E W , are flat within the kinematically allowed boundaries,
γ (E
b,W − βp
∗
) < E b,W < γ (E
b,W + βp
∗
) ,
(2.17)
where p
∗ is given in (2.10) and E
b,W = p
∗2
+ m
2
b,W . The minimum of E b becomes
smaller for increasing top quark momenta p and approaches m b for large values of p,
above 1500 GeV. At p = 550 GeV the minimum of E b is about 10 GeV. The result
is that even at very high values of p very soft b quarks will emerge from the top
quark decay, which are not detectable. However, since the E b distribution is flat, the
relative occurrence of very soft b quarks will decrease with increasing p.
The decay angle distribution of the two quarks from the W boson decay follows
from an admixture of longitudinal and transverse W polarisation states. Convoluted
with the flat distribution of E W , this leads to a peak in the quark momentum distribution and a steeply falling tail with a maximum value slightly above p. Overall, the
distributions of the light quark momenta are softer than the distribution of the b quark
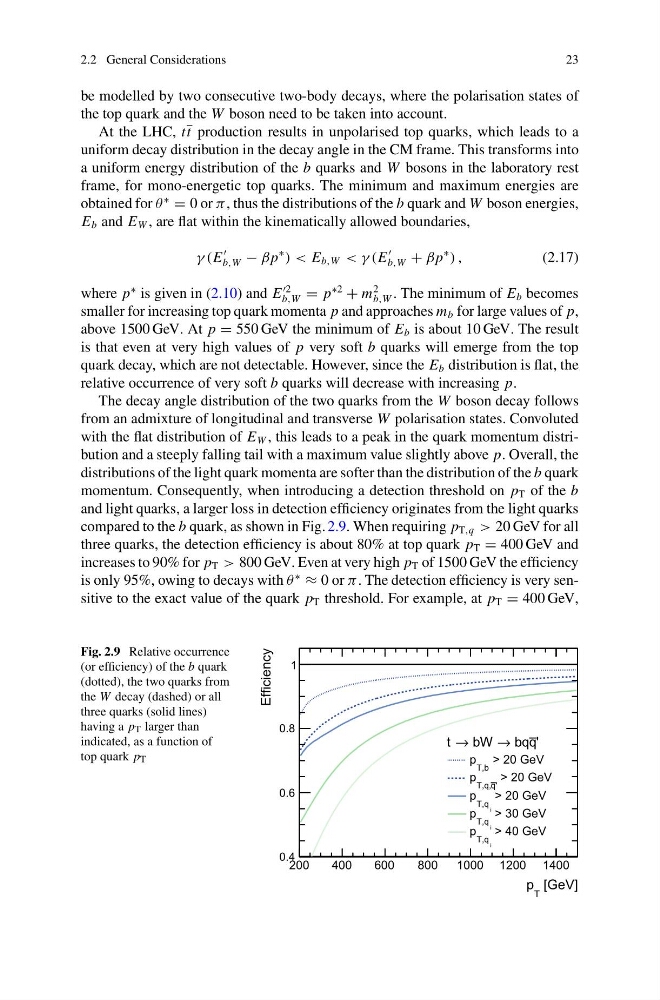
momentum. Consequently, when introducing a detection threshold on p T of the b
and light quarks, a larger loss in detection efficiency originates from the light quarks
compared to the b quark, as shown in Fig. 2.9. When requiring p T,q > 20 GeV for all
three quarks, the detection efficiency is about 80% at top quark p T = 400 GeV and
increases to 90% for p T > 800 GeV. Even at very high p T of 1500 GeV the efficiency
is only 95%, owing to decays with θ
∗
≈ 0 or π . The detection efficiency is very sensitive to the exact value of the quark p T threshold. For example, at p T = 400 GeV,
Fig. 2.9 Relative occurrence
(or efficiency) of the b quark
(dotted), the two quarks from
the W decay (dashed) or all
three quarks (solid lines)
having a p T larger than
indicated, as a function of
top quark p T
[GeV]
T
p
200
400
600
800
1000 1200 1400
Efficiency
0.4
0.6
0.8
1
'
q
bq
→
bW
→
t
> 20 GeV
T,b
p
> 20 GeV
'
q
T,q,
p
> 20 GeV
i
T,q
p
> 30 GeV
i
T,q
p
> 40 GeV
i
T,q
p
23
be modelled by two consecutive two-body decays, where the polarisation states of
the top quark and the W boson need to be taken into account.
At the LHC, tt production results in unpolarised top quarks, which leads to a
uniform decay distribution in the decay angle in the CM frame. This transforms into
a uniform energy distribution of the b quarks and W bosons in the laboratory rest
frame, for mono-energetic top quarks. The minimum and maximum energies are
obtained for θ
∗
= 0 or π , thus the distributions of the b quark and W boson energies,
E b and E W , are flat within the kinematically allowed boundaries,
γ (E
b,W − βp
∗
) < E b,W < γ (E
b,W + βp
∗
) ,
(2.17)
where p
∗ is given in (2.10) and E
b,W = p
∗2
+ m
2
b,W . The minimum of E b becomes
smaller for increasing top quark momenta p and approaches m b for large values of p,
above 1500 GeV. At p = 550 GeV the minimum of E b is about 10 GeV. The result
is that even at very high values of p very soft b quarks will emerge from the top
quark decay, which are not detectable. However, since the E b distribution is flat, the
relative occurrence of very soft b quarks will decrease with increasing p.
The decay angle distribution of the two quarks from the W boson decay follows
from an admixture of longitudinal and transverse W polarisation states. Convoluted
with the flat distribution of E W , this leads to a peak in the quark momentum distribution and a steeply falling tail with a maximum value slightly above p. Overall, the
distributions of the light quark momenta are softer than the distribution of the b quark
momentum. Consequently, when introducing a detection threshold on p T of the b
and light quarks, a larger loss in detection efficiency originates from the light quarks
compared to the b quark, as shown in Fig. 2.9. When requiring p T,q > 20 GeV for all
three quarks, the detection efficiency is about 80% at top quark p T = 400 GeV and
increases to 90% for p T > 800 GeV. Even at very high p T of 1500 GeV the efficiency
is only 95%, owing to decays with θ
∗
≈ 0 or π . The detection efficiency is very sensitive to the exact value of the quark p T threshold. For example, at p T = 400 GeV,
Fig. 2.9 Relative occurrence
(or efficiency) of the b quark
(dotted), the two quarks from
the W decay (dashed) or all
three quarks (solid lines)
having a p T larger than
indicated, as a function of
top quark p T
[GeV]
T
p
200
400
600
800
1000 1200 1400
Efficiency
0.4
0.6
0.8
1
'
q
bq
→
bW
→
t
> 20 GeV
T,b
p
> 20 GeV
'
q
T,q,
p
> 20 GeV
i
T,q
p
> 30 GeV
i
T,q
p
> 40 GeV
i
T,q
p