

158
5 Direct Searches for New Physics
[GeV]
T
m
700 800 900 1000 1100 1200 1300 1400
) [pb]
T
T
→
(pp
σ
3
−
10
2
−
10
1
−
10
1
10
)
σ
1
±
Theory (NNLO prediction
95% CL combined observed
95% CL combined expected
σ
1
±
95% CL expected limit
σ
2
±
95% CL expected limit
H(bb)t+X
)b+X
ν
W(l
Z(ll)t/b+X
Tril./s.s. dilep.
Fully-had.
)t+X
ν
ν
Z(
ATLAS
-1
= 13 TeV, 36.1 fb
s
SU(2) singlet
[GeV]
B
m
700 800 900 1000 1100 1200 1300 1400
) [pb]
B
B
→
(pp
σ
3
−
10
2
−
10
1
−
10
1
10
)
σ
1
±
Theory (NNLO prediction
95% CL combined observed
95% CL combined expected
σ
1
±
95% CL expected limit
σ
2
±
95% CL expected limit
)t+X
ν
W(l
Z(ll)t/b+X
Tril./s.s. dilep.
Fully-had.
ATLAS
-1
= 13 TeV, 36.1 fb
s
SU(2) singlet
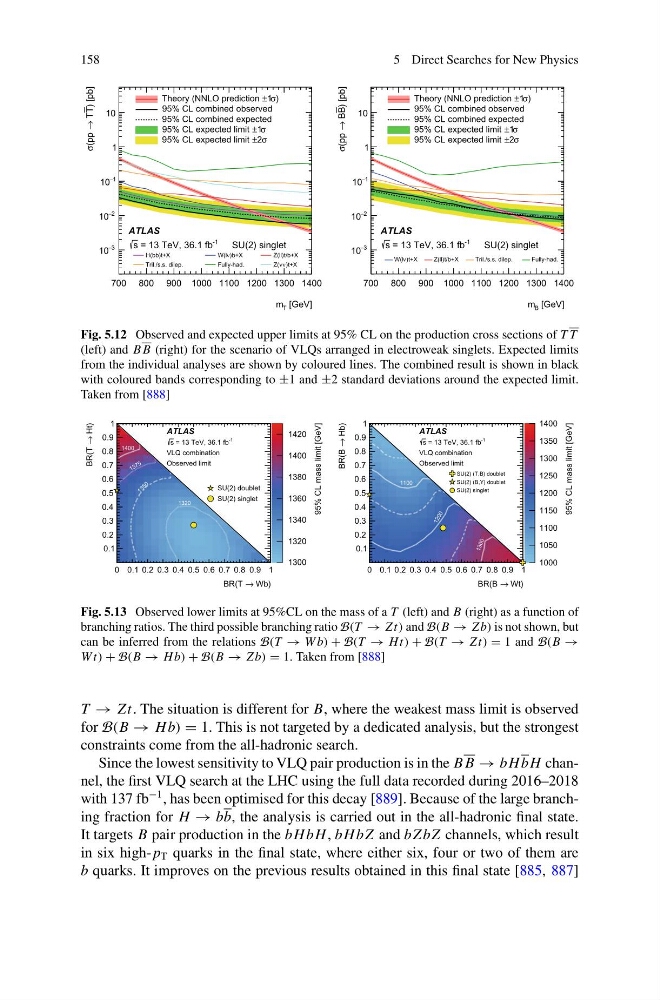
Fig. 5.12 Observed and expected upper limits at 95% CL on the production cross sections of T T
(left) and B B (right) for the scenario of VLQs arranged in electroweak singlets. Expected limits
from the individual analyses are shown by coloured lines. The combined result is shown in black
with coloured bands corresponding to ±1 and ±2 standard deviations around the expected limit.
Taken from [888]
0 0.1 0.2 0.3 0.4 0.5 0.6 0.7 0.8 0.9 1
Wb)
→
BR(T
0.1
0.2
0.3
0.4
0.5
0.6
0.7
0.8
0.9
1
Ht)
→
BR(T
1300
1320
1340
1360
1380
1400
1420
95% CL mass limit [GeV]
ATLAS
-1
= 13 TeV, 36.1 fb
s
VLQ combination
Observed limit
1320
1 3 5 0
1 3 7 5
1400
SU(2) doublet
SU(2) singlet
0 0.1 0.2 0.3 0.4 0.5 0.6 0.7 0.8 0.9 1
Wt)
→
BR(B
0.1
0.2
0.3
0.4
0.5
0.6
0.7
0.8
0.9
1
Hb)
→
BR(B
1000
1050
1100
1150
1200
1250
1300
1350
1400
95% CL mass limit [GeV]
ATLAS
-1
= 13 TeV, 36.1 fb
s
VLQ combination
Observed limit
1100
1 2 0 0
13 00
SU(2) (T,B) doublet
SU(2) (B,Y) doublet
SU(2) singlet
Fig. 5.13 Observed lower limits at 95%CL on the mass of a T (left) and B (right) as a function of
branching ratios. The third possible branching ratio B(T → Zt) and B(B → Zb) is not shown, but
can be inferred from the relations B(T → W b) + B(T → Ht) + B(T → Zt) = 1 and B(B →
W t) + B(B → Hb) + B(B → Zb) = 1. Taken from [888]
T → Zt. The situation is different for B, where the weakest mass limit is observed
for B(B → Hb) = 1. This is not targeted by a dedicated analysis, but the strongest
constraints come from the all-hadronic search.
Since the lowest sensitivity to VLQ pair production is in the B B → bHbH channel, the first VLQ search at the LHC using the full data recorded during 2016–2018
with 137 fb
−1 , has been optimised for this decay [889]. Because of the large branching fraction for H → bb, the analysis is carried out in the all-hadronic final state.
It targets B pair production in the bHbH, bHbZ and bZbZ channels, which result
in six high- p T quarks in the final state, where either six, four or two of them are
b quarks. It improves on the previous results obtained in this final state [885, 887]
5 Direct Searches for New Physics
[GeV]
T
m
700 800 900 1000 1100 1200 1300 1400
) [pb]
T
T
→
(pp
σ
3
−
10
2
−
10
1
−
10
1
10
)
σ
1
±
Theory (NNLO prediction
95% CL combined observed
95% CL combined expected
σ
1
±
95% CL expected limit
σ
2
±
95% CL expected limit
H(bb)t+X
)b+X
ν
W(l
Z(ll)t/b+X
Tril./s.s. dilep.
Fully-had.
)t+X
ν
ν
Z(
ATLAS
-1
= 13 TeV, 36.1 fb
s
SU(2) singlet
[GeV]
B
m
700 800 900 1000 1100 1200 1300 1400
) [pb]
B
B
→
(pp
σ
3
−
10
2
−
10
1
−
10
1
10
)
σ
1
±
Theory (NNLO prediction
95% CL combined observed
95% CL combined expected
σ
1
±
95% CL expected limit
σ
2
±
95% CL expected limit
)t+X
ν
W(l
Z(ll)t/b+X
Tril./s.s. dilep.
Fully-had.
ATLAS
-1
= 13 TeV, 36.1 fb
s
SU(2) singlet
Fig. 5.12 Observed and expected upper limits at 95% CL on the production cross sections of T T
(left) and B B (right) for the scenario of VLQs arranged in electroweak singlets. Expected limits
from the individual analyses are shown by coloured lines. The combined result is shown in black
with coloured bands corresponding to ±1 and ±2 standard deviations around the expected limit.
Taken from [888]
0 0.1 0.2 0.3 0.4 0.5 0.6 0.7 0.8 0.9 1
Wb)
→
BR(T
0.1
0.2
0.3
0.4
0.5
0.6
0.7
0.8
0.9
1
Ht)
→
BR(T
1300
1320
1340
1360
1380
1400
1420
95% CL mass limit [GeV]
ATLAS
-1
= 13 TeV, 36.1 fb
s
VLQ combination
Observed limit
1320
1 3 5 0
1 3 7 5
1400
SU(2) doublet
SU(2) singlet
0 0.1 0.2 0.3 0.4 0.5 0.6 0.7 0.8 0.9 1
Wt)
→
BR(B
0.1
0.2
0.3
0.4
0.5
0.6
0.7
0.8
0.9
1
Hb)
→
BR(B
1000
1050
1100
1150
1200
1250
1300
1350
1400
95% CL mass limit [GeV]
ATLAS
-1
= 13 TeV, 36.1 fb
s
VLQ combination
Observed limit
1100
1 2 0 0
13 00
SU(2) (T,B) doublet
SU(2) (B,Y) doublet
SU(2) singlet
Fig. 5.13 Observed lower limits at 95%CL on the mass of a T (left) and B (right) as a function of
branching ratios. The third possible branching ratio B(T → Zt) and B(B → Zb) is not shown, but
can be inferred from the relations B(T → W b) + B(T → Ht) + B(T → Zt) = 1 and B(B →
W t) + B(B → Hb) + B(B → Zb) = 1. Taken from [888]
T → Zt. The situation is different for B, where the weakest mass limit is observed
for B(B → Hb) = 1. This is not targeted by a dedicated analysis, but the strongest
constraints come from the all-hadronic search.
Since the lowest sensitivity to VLQ pair production is in the B B → bHbH channel, the first VLQ search at the LHC using the full data recorded during 2016–2018
with 137 fb
−1 , has been optimised for this decay [889]. Because of the large branching fraction for H → bb, the analysis is carried out in the all-hadronic final state.
It targets B pair production in the bHbH, bHbZ and bZbZ channels, which result
in six high- p T quarks in the final state, where either six, four or two of them are
b quarks. It improves on the previous results obtained in this final state [885, 887]