

5.2 Resonances Coupling to Third Generation Quarks
145
non-isolated lepton selection, the background from multijet production is larger than
in analyses with an isolated lepton. This background is larger in the electron than
in the muon channel, because of larger misidentification probabilities for electrons.
In ATLAS, the multijet background is estimated from a sideband region, obtained
with a looser set of lepton identification criteria and small p
miss
T
[817]. In CMS, the
multijet background is reduced to a negligible level by a selection of p
miss
T
> 50 and
120 GeV for the muon and electron channels, respectively [808]. The shape of the
W +jets background is obtained from simulation in ATLAS and CMS. While ATLAS
determines its normalisation from the W charge asymmetry, CMS reduces this background with a dedicated BDT, trained on the kinematic variables of jets and the
lepton, as well as global event shapes. The output distribution of the BDT is used
to separate events into the signal region and a W +jets control region. The measured
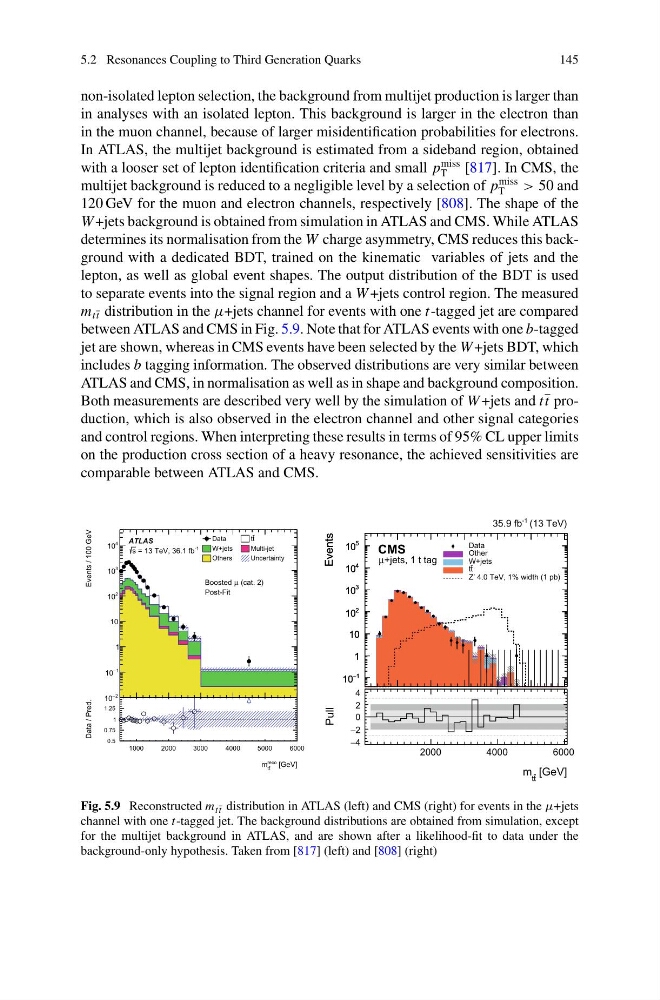
m tt distribution in the μ+jets channel for events with one t-tagged jet are compared
between ATLAS and CMS in Fig. 5.9. Note that for ATLAS events with one b-tagged
jet are shown, whereas in CMS events have been selected by the W +jets BDT, which
includes b tagging information. The observed distributions are very similar between
ATLAS and CMS, in normalisation as well as in shape and background composition.
Both measurements are described very well by the simulation of W +jets and tt production, which is also observed in the electron channel and other signal categories
and control regions. When interpreting these results in terms of 95% CL upper limits
on the production cross section of a heavy resonance, the achieved sensitivities are
comparable between ATLAS and CMS.
[GeV]
reco
t
t
m
1000
2000
3000
4000
5000
6000
Data / Pred.
0.5
0.75
1
1.25
1.5
Events / 100 GeV
2
−
10
1
−
10
1
10
2
10
3
10
4
10
ATLAS
-1
= 13 TeV, 36.1 fb
s
(cat. 2)
μ
Boosted
Post-Fit
Data
t
t
W+jets
Multi-jet
Others
Uncertainty
Events
1
−
10
1
10
2
10
3
10
4
10
5
10
Events
1
−
10
1
10
2
10
3
10
4
10
5
10
Data
Other
W+jets
t
t
Z’ 4.0 TeV, 1% width (1 pb)
+jets, 1 t tag
μ
(13 TeV)
-1
35.9 fb
CMS
[GeV]
t
t
m
2000
4000
6000
Pull
4
−
2
−
0
2
4
Fig. 5.9 Reconstructed m tt distribution in ATLAS (left) and CMS (right) for events in the μ+jets
channel with one t-tagged jet. The background distributions are obtained from simulation, except
for the multijet background in ATLAS, and are shown after a likelihood-fit to data under the
background-only hypothesis. Taken from [817] (left) and [808] (right)
145
non-isolated lepton selection, the background from multijet production is larger than
in analyses with an isolated lepton. This background is larger in the electron than
in the muon channel, because of larger misidentification probabilities for electrons.
In ATLAS, the multijet background is estimated from a sideband region, obtained
with a looser set of lepton identification criteria and small p
miss
T
[817]. In CMS, the
multijet background is reduced to a negligible level by a selection of p
miss
T
> 50 and
120 GeV for the muon and electron channels, respectively [808]. The shape of the
W +jets background is obtained from simulation in ATLAS and CMS. While ATLAS
determines its normalisation from the W charge asymmetry, CMS reduces this background with a dedicated BDT, trained on the kinematic variables of jets and the
lepton, as well as global event shapes. The output distribution of the BDT is used
to separate events into the signal region and a W +jets control region. The measured
m tt distribution in the μ+jets channel for events with one t-tagged jet are compared
between ATLAS and CMS in Fig. 5.9. Note that for ATLAS events with one b-tagged
jet are shown, whereas in CMS events have been selected by the W +jets BDT, which
includes b tagging information. The observed distributions are very similar between
ATLAS and CMS, in normalisation as well as in shape and background composition.
Both measurements are described very well by the simulation of W +jets and tt production, which is also observed in the electron channel and other signal categories
and control regions. When interpreting these results in terms of 95% CL upper limits
on the production cross section of a heavy resonance, the achieved sensitivities are
comparable between ATLAS and CMS.
[GeV]
reco
t
t
m
1000
2000
3000
4000
5000
6000
Data / Pred.
0.5
0.75
1
1.25
1.5
Events / 100 GeV
2
−
10
1
−
10
1
10
2
10
3
10
4
10
ATLAS
-1
= 13 TeV, 36.1 fb
s
(cat. 2)
μ
Boosted
Post-Fit
Data
t
t
W+jets
Multi-jet
Others
Uncertainty
Events
1
−
10
1
10
2
10
3
10
4
10
5
10
Events
1
−
10
1
10
2
10
3
10
4
10
5
10
Data
Other
W+jets
t
t
Z’ 4.0 TeV, 1% width (1 pb)
+jets, 1 t tag
μ
(13 TeV)
-1
35.9 fb
CMS
[GeV]
t
t
m
2000
4000
6000
Pull
4
−
2
−
0
2
4
Fig. 5.9 Reconstructed m tt distribution in ATLAS (left) and CMS (right) for events in the μ+jets
channel with one t-tagged jet. The background distributions are obtained from simulation, except
for the multijet background in ATLAS, and are shown after a likelihood-fit to data under the
background-only hypothesis. Taken from [817] (left) and [808] (right)