

132
5 Direct Searches for New Physics
[GeV]
lead
2j
m
60
80
100
120
140
160
180
200
[GeV]
subl
2j
m
60
80
100
120
140
160
180
200
2
Events / 25 GeV
0
20
40
60
80
100
120
140
160
180
200
220
ATLAS
Resolved, 2016
-1
= 13 TeV, 24.3 fb
s
2
Events / 25 GeV
0
100
200
300
[GeV]
lead
J
m
50
100
150
200
250
[GeV]
subl
J
m
50
100
150
200
250
ATLAS
-1
=13 TeV, 36.1 fb
s
BoostedT.T
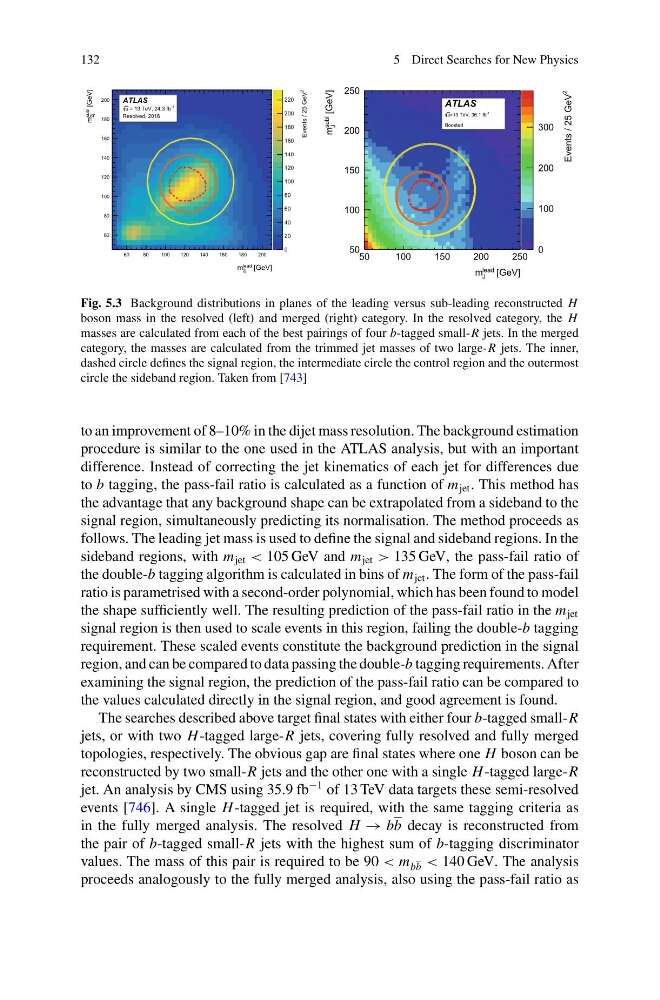
Fig. 5.3 Background distributions in planes of the leading versus sub-leading reconstructed H
boson mass in the resolved (left) and merged (right) category. In the resolved category, the H
masses are calculated from each of the best pairings of four b-tagged small-R jets. In the merged
category, the masses are calculated from the trimmed jet masses of two large-R jets. The inner,
dashed circle defines the signal region, the intermediate circle the control region and the outermost
circle the sideband region. Taken from [743]
to an improvement of 8–10% in the dijet mass resolution. The background estimation
procedure is similar to the one used in the ATLAS analysis, but with an important
difference. Instead of correcting the jet kinematics of each jet for differences due
to b tagging, the pass-fail ratio is calculated as a function of m jet . This method has
the advantage that any background shape can be extrapolated from a sideband to the
signal region, simultaneously predicting its normalisation. The method proceeds as
follows. The leading jet mass is used to define the signal and sideband regions. In the
sideband regions, with m jet < 105 GeV and m jet > 135 GeV, the pass-fail ratio of
the double-b tagging algorithm is calculated in bins of m jet . The form of the pass-fail
ratio is parametrised with a second-order polynomial, which has been found to model
the shape sufficiently well. The resulting prediction of the pass-fail ratio in the m jet
signal region is then used to scale events in this region, failing the double-b tagging
requirement. These scaled events constitute the background prediction in the signal
region, and can be compared to data passing the double-b tagging requirements. After
examining the signal region, the prediction of the pass-fail ratio can be compared to
the values calculated directly in the signal region, and good agreement is found.
The searches described above target final states with either four b-tagged small-R
jets, or with two H -tagged large-R jets, covering fully resolved and fully merged
topologies, respectively. The obvious gap are final states where one H boson can be
reconstructed by two small-R jets and the other one with a single H -tagged large-R
jet. An analysis by CMS using 35.9 fb
−1 of 13 TeV data targets these semi-resolved
events [746]. A single H -tagged jet is required, with the same tagging criteria as
in the fully merged analysis. The resolved H → bb decay is reconstructed from
the pair of b-tagged small-R jets with the highest sum of b-tagging discriminator
values. The mass of this pair is required to be 90 < m bb < 140 GeV. The analysis
proceeds analogously to the fully merged analysis, also using the pass-fail ratio as
5 Direct Searches for New Physics
[GeV]
lead
2j
m
60
80
100
120
140
160
180
200
[GeV]
subl
2j
m
60
80
100
120
140
160
180
200
2
Events / 25 GeV
0
20
40
60
80
100
120
140
160
180
200
220
ATLAS
Resolved, 2016
-1
= 13 TeV, 24.3 fb
s
2
Events / 25 GeV
0
100
200
300
[GeV]
lead
J
m
50
100
150
200
250
[GeV]
subl
J
m
50
100
150
200
250
ATLAS
-1
=13 TeV, 36.1 fb
s
BoostedT.T
Fig. 5.3 Background distributions in planes of the leading versus sub-leading reconstructed H
boson mass in the resolved (left) and merged (right) category. In the resolved category, the H
masses are calculated from each of the best pairings of four b-tagged small-R jets. In the merged
category, the masses are calculated from the trimmed jet masses of two large-R jets. The inner,
dashed circle defines the signal region, the intermediate circle the control region and the outermost
circle the sideband region. Taken from [743]
to an improvement of 8–10% in the dijet mass resolution. The background estimation
procedure is similar to the one used in the ATLAS analysis, but with an important
difference. Instead of correcting the jet kinematics of each jet for differences due
to b tagging, the pass-fail ratio is calculated as a function of m jet . This method has
the advantage that any background shape can be extrapolated from a sideband to the
signal region, simultaneously predicting its normalisation. The method proceeds as
follows. The leading jet mass is used to define the signal and sideband regions. In the
sideband regions, with m jet < 105 GeV and m jet > 135 GeV, the pass-fail ratio of
the double-b tagging algorithm is calculated in bins of m jet . The form of the pass-fail
ratio is parametrised with a second-order polynomial, which has been found to model
the shape sufficiently well. The resulting prediction of the pass-fail ratio in the m jet
signal region is then used to scale events in this region, failing the double-b tagging
requirement. These scaled events constitute the background prediction in the signal
region, and can be compared to data passing the double-b tagging requirements. After
examining the signal region, the prediction of the pass-fail ratio can be compared to
the values calculated directly in the signal region, and good agreement is found.
The searches described above target final states with either four b-tagged small-R
jets, or with two H -tagged large-R jets, covering fully resolved and fully merged
topologies, respectively. The obvious gap are final states where one H boson can be
reconstructed by two small-R jets and the other one with a single H -tagged large-R
jet. An analysis by CMS using 35.9 fb
−1 of 13 TeV data targets these semi-resolved
events [746]. A single H -tagged jet is required, with the same tagging criteria as
in the fully merged analysis. The resolved H → bb decay is reconstructed from
the pair of b-tagged small-R jets with the highest sum of b-tagging discriminator
values. The mass of this pair is required to be 90 < m bb < 140 GeV. The analysis
proceeds analogously to the fully merged analysis, also using the pass-fail ratio as