

5.1 Diboson Resonances
127
(GeV)
j
m
Events / 5 GeV
0
10
20
30
40
50
60
70
(13 TeV)
-1
35.9 fb
CMS
ν
ν
qq
→
VZ
→
X
High purity
LSB
SR
Higgs
HSB
LSB
SR
Higgs
HSB
Data
V + jets
Top quark
VV
Bkg. unc.
(GeV)
j
m
50
100
150
200
250
300
Stat. Unc. (data)
bkg
- N
data
N
4
−
2
−
0
2
4
(GeV)
T
VZ
m
Events / 100 GeV
2
−
10
1
−
10
1
10
2
10
3
10
(13 TeV)
-1
35.9 fb
CMS
ν
ν
qq
→
VZ
→
X
High purity
Data
V + jets
Top quark
VV
Bkg. unc.
= 3 TeV (10 fb)
W'
m
(GeV)
T
VZ
m
1000
1500
2000
2500
3000
3500
4000
Stat. Unc. (data)
bkg
- N
data
N
4
−
2
−
0
2
4
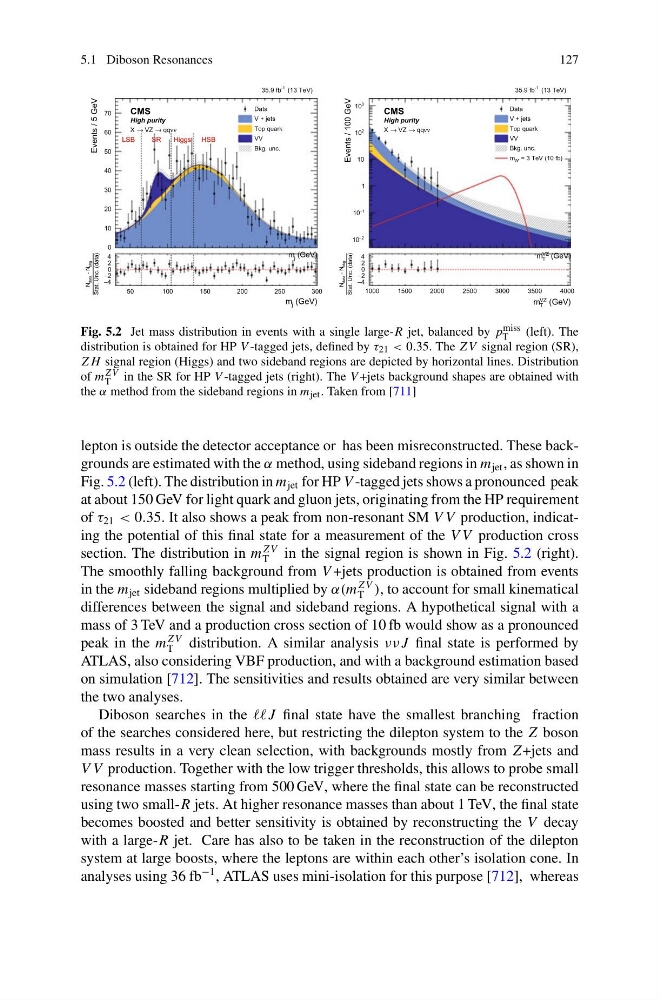
Fig. 5.2 Jet mass distribution in events with a single large-R jet, balanced by p miss
T
(left). The
distribution is obtained for HP V -tagged jets, defined by τ 21 < 0.35. The Z V signal region (SR),
Z H signal region (Higgs) and two sideband regions are depicted by horizontal lines. Distribution
of m Z V
T in the SR for HP V -tagged jets (right). The V +jets background shapes are obtained with
the α method from the sideband regions in m jet . Taken from [711]
lepton is outside the detector acceptance or has been misreconstructed. These backgrounds are estimated with the α method, using sideband regions in m jet , as shown in
Fig. 5.2 (left). The distribution in m jet for HP V -tagged jets shows a pronounced peak
at about 150 GeV for light quark and gluon jets, originating from the HP requirement
of τ 21 < 0.35. It also shows a peak from non-resonant SM V V production, indicating the potential of this final state for a measurement of the V V production cross
section. The distribution in m
Z V
T in the signal region is shown in Fig. 5.2 (right).
The smoothly falling background from V +jets production is obtained from events
in the m jet sideband regions multiplied by α(m
Z V
T ), to account for small kinematical
differences between the signal and sideband regions. A hypothetical signal with a
mass of 3 TeV and a production cross section of 10 fb would show as a pronounced
peak in the m
Z V
T
distribution. A similar analysis νν J final state is performed by
ATLAS, also considering VBF production, and with a background estimation based
on simulation [712]. The sensitivities and results obtained are very similar between
the two analyses.
Diboson searches in the final state have the smallest branching fraction
of the searches considered here, but restricting the dilepton system to the Z boson
mass results in a very clean selection, with backgrounds mostly from Z +jets and
V V production. Together with the low trigger thresholds, this allows to probe small
resonance masses starting from 500 GeV, where the final state can be reconstructed
using two small-R jets. At higher resonance masses than about 1 TeV, the final state
becomes boosted and better sensitivity is obtained by reconstructing the V decay
with a large-R jet. Care has also to be taken in the reconstruction of the dilepton
system at large boosts, where the leptons are within each other’s isolation cone. In
analyses using 36 fb
−1 , ATLAS uses mini-isolation for this purpose [712], whereas
127
(GeV)
j
m
Events / 5 GeV
0
10
20
30
40
50
60
70
(13 TeV)
-1
35.9 fb
CMS
ν
ν
→
VZ
→
X
High purity
LSB
SR
Higgs
HSB
LSB
SR
Higgs
HSB
Data
V + jets
Top quark
VV
Bkg. unc.
(GeV)
j
m
50
100
150
200
250
300
Stat. Unc. (data)
bkg
- N
data
N
4
−
2
−
0
2
4
(GeV)
T
VZ
m
Events / 100 GeV
2
−
10
1
−
10
1
10
2
10
3
10
(13 TeV)
-1
35.9 fb
CMS
ν
ν
→
VZ
→
X
High purity
Data
V + jets
Top quark
VV
Bkg. unc.
= 3 TeV (10 fb)
W'
m
(GeV)
T
VZ
m
1000
1500
2000
2500
3000
3500
4000
Stat. Unc. (data)
bkg
- N
data
N
4
−
2
−
0
2
4
Fig. 5.2 Jet mass distribution in events with a single large-R jet, balanced by p miss
T
(left). The
distribution is obtained for HP V -tagged jets, defined by τ 21 < 0.35. The Z V signal region (SR),
Z H signal region (Higgs) and two sideband regions are depicted by horizontal lines. Distribution
of m Z V
T in the SR for HP V -tagged jets (right). The V +jets background shapes are obtained with
the α method from the sideband regions in m jet . Taken from [711]
lepton is outside the detector acceptance or has been misreconstructed. These backgrounds are estimated with the α method, using sideband regions in m jet , as shown in
Fig. 5.2 (left). The distribution in m jet for HP V -tagged jets shows a pronounced peak
at about 150 GeV for light quark and gluon jets, originating from the HP requirement
of τ 21 < 0.35. It also shows a peak from non-resonant SM V V production, indicating the potential of this final state for a measurement of the V V production cross
section. The distribution in m
Z V
T in the signal region is shown in Fig. 5.2 (right).
The smoothly falling background from V +jets production is obtained from events
in the m jet sideband regions multiplied by α(m
Z V
T ), to account for small kinematical
differences between the signal and sideband regions. A hypothetical signal with a
mass of 3 TeV and a production cross section of 10 fb would show as a pronounced
peak in the m
Z V
T
distribution. A similar analysis νν J final state is performed by
ATLAS, also considering VBF production, and with a background estimation based
on simulation [712]. The sensitivities and results obtained are very similar between
the two analyses.
Diboson searches in the final state have the smallest branching fraction
of the searches considered here, but restricting the dilepton system to the Z boson
mass results in a very clean selection, with backgrounds mostly from Z +jets and
V V production. Together with the low trigger thresholds, this allows to probe small
resonance masses starting from 500 GeV, where the final state can be reconstructed
using two small-R jets. At higher resonance masses than about 1 TeV, the final state
becomes boosted and better sensitivity is obtained by reconstructing the V decay
with a large-R jet. Care has also to be taken in the reconstruction of the dilepton
system at large boosts, where the leptons are within each other’s isolation cone. In
analyses using 36 fb
−1 , ATLAS uses mini-isolation for this purpose [712], whereas