

124
5 Direct Searches for New Physics
f (x) = p 1 (1 − x)
p 2 −ξ p 3 x
− p 3
(5.1)
to adequately model the background, where x = m jj /
√
s, p i are free parameters and
ξ is a constant, introduced to minimise the correlation between p 2 and p 3 .
The all-hadronic CMS analysis on 36.7 fb
−1 of data [437] follows the same overall
strategy. The V tagging algorithm used is less complicated, based on a selection using
PUPPI soft-drop mass and τ 21 . In order to retain high signal efficiency at high m jj
and sufficient background rejection at low m jj , two V tag categories are defined.
These are based on the τ 21 selection, where low purity (LP, 0.35 < τ 21 < 0.75) and
high purity (HP, τ 21 < 0.35) tags have about the same signal efficiency. The HP
selection has a higher background rejection than the LP tag. Taken together, the
signal efficiency is close to 99%. The optimal use of the LP and HP tags is obtained
by classifying events into LP+HP and HP+HP, depending on the V tag of the two
leading large-R jets in the event. Two additional categories are introduced, where
only one jet is V tagged with LP or HP, to achieve sensitivity to resonances decaying
to qW and q Z. In total, 10 exclusive categories are formed and the same background
parametrisation as used by ATLAS is found to describe the data. While the full
functional form is needed for the qV categories, only two parameters are sufficient
to describe the V V categories, obtained by setting p 2 = ξ = 0 in (5.1).
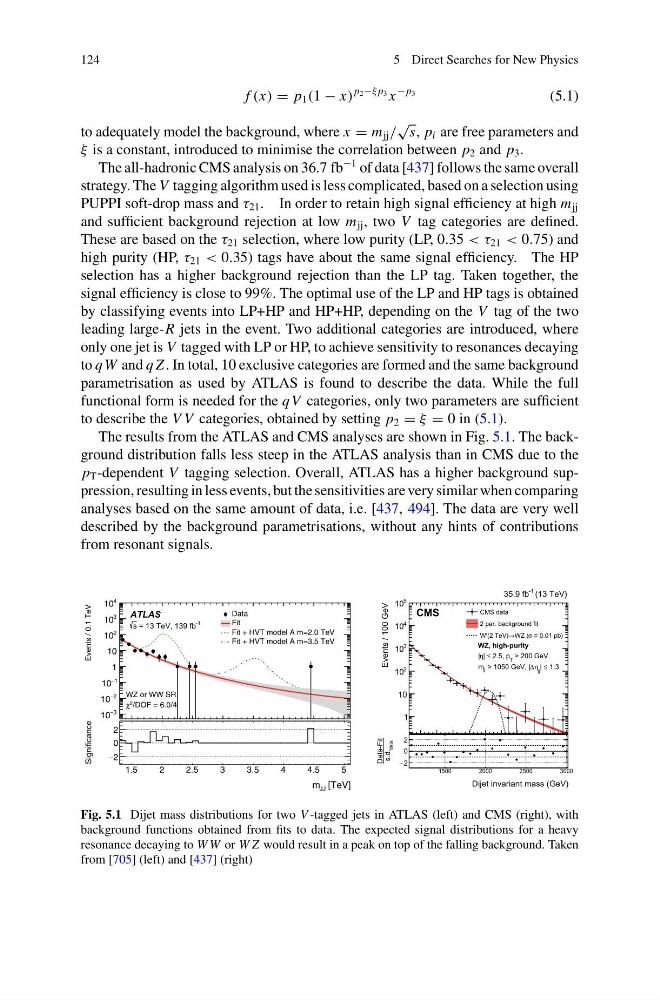
The results from the ATLAS and CMS analyses are shown in Fig. 5.1. The background distribution falls less steep in the ATLAS analysis than in CMS due to the
p T -dependent V tagging selection. Overall, ATLAS has a higher background suppression, resulting in less events, but the sensitivities are very similar when comparing
analyses based on the same amount of data, i.e. [437, 494]. The data are very well
described by the background parametrisations, without any hints of contributions
from resonant signals.
3
−
10
2
−
10
1
−
10
1
10
2
10
3
10
4
10
Data
Fit
Fit + HVT model A m=2.0 TeV
Fit + HVT model A m=3.5 TeV
WZ or WW SR
/DOF = 6.0/4
2
χ
1.5
2
2.5
3
3.5
4
4.5
5
2
−
0
2
ATLAS
s = 13 TeV, 139 fb -1
Dijet invariant mass (GeV)
1200 14001600 1800 2000 22002400 2600 28003000
Events / 100 GeV
1
10
2
10
3
10
4
10
5
10
CMS data
2 par. background fit
= 0.01 pb)
σ
WZ (
→
W'(2 TeV)
WZ, high-purity
> 200 GeV
T
2.5, p
≤
|
η
|
1.3
≤
|
jj
η
Δ
> 1050 GeV, |
jj
m
(13 TeV)
-1
35.9 fb
CMS
1500
2000
2500
3000
2
−
0
2
[TeV]
JJ
m
Events / 0.1 TeV
Significance
data
s.d.
Data-Fit
Dijet invariant mass (GeV)
Fig. 5.1 Dijet mass distributions for two V -tagged jets in ATLAS (left) and CMS (right), with
background functions obtained from fits to data. The expected signal distributions for a heavy
resonance decaying to W W or W Z would result in a peak on top of the falling background. Taken
from [705] (left) and [437] (right)
5 Direct Searches for New Physics
f (x) = p 1 (1 − x)
p 2 −ξ p 3 x
− p 3
(5.1)
to adequately model the background, where x = m jj /
√
s, p i are free parameters and
ξ is a constant, introduced to minimise the correlation between p 2 and p 3 .
The all-hadronic CMS analysis on 36.7 fb
−1 of data [437] follows the same overall
strategy. The V tagging algorithm used is less complicated, based on a selection using
PUPPI soft-drop mass and τ 21 . In order to retain high signal efficiency at high m jj
and sufficient background rejection at low m jj , two V tag categories are defined.
These are based on the τ 21 selection, where low purity (LP, 0.35 < τ 21 < 0.75) and
high purity (HP, τ 21 < 0.35) tags have about the same signal efficiency. The HP
selection has a higher background rejection than the LP tag. Taken together, the
signal efficiency is close to 99%. The optimal use of the LP and HP tags is obtained
by classifying events into LP+HP and HP+HP, depending on the V tag of the two
leading large-R jets in the event. Two additional categories are introduced, where
only one jet is V tagged with LP or HP, to achieve sensitivity to resonances decaying
to qW and q Z. In total, 10 exclusive categories are formed and the same background
parametrisation as used by ATLAS is found to describe the data. While the full
functional form is needed for the qV categories, only two parameters are sufficient
to describe the V V categories, obtained by setting p 2 = ξ = 0 in (5.1).
The results from the ATLAS and CMS analyses are shown in Fig. 5.1. The background distribution falls less steep in the ATLAS analysis than in CMS due to the
p T -dependent V tagging selection. Overall, ATLAS has a higher background suppression, resulting in less events, but the sensitivities are very similar when comparing
analyses based on the same amount of data, i.e. [437, 494]. The data are very well
described by the background parametrisations, without any hints of contributions
from resonant signals.
3
−
10
2
−
10
1
−
10
1
10
2
10
3
10
4
10
Data
Fit
Fit + HVT model A m=2.0 TeV
Fit + HVT model A m=3.5 TeV
WZ or WW SR
/DOF = 6.0/4
2
χ
1.5
2
2.5
3
3.5
4
4.5
5
2
−
0
2
ATLAS
s = 13 TeV, 139 fb -1
Dijet invariant mass (GeV)
1200 14001600 1800 2000 22002400 2600 28003000
Events / 100 GeV
1
10
2
10
3
10
4
10
5
10
CMS data
2 par. background fit
= 0.01 pb)
σ
WZ (
→
W'(2 TeV)
WZ, high-purity
> 200 GeV
T
2.5, p
≤
|
η
|
1.3
≤
|
jj
η
Δ
> 1050 GeV, |
jj
m
(13 TeV)
-1
35.9 fb
CMS
1500
2000
2500
3000
2
−
0
2
[TeV]
JJ
m
Events / 0.1 TeV
Significance
data
s.d.
Data-Fit
Dijet invariant mass (GeV)
Fig. 5.1 Dijet mass distributions for two V -tagged jets in ATLAS (left) and CMS (right), with
background functions obtained from fits to data. The expected signal distributions for a heavy
resonance decaying to W W or W Z would result in a peak on top of the falling background. Taken
from [705] (left) and [437] (right)