

8.3 What the Neural Network Sees
143
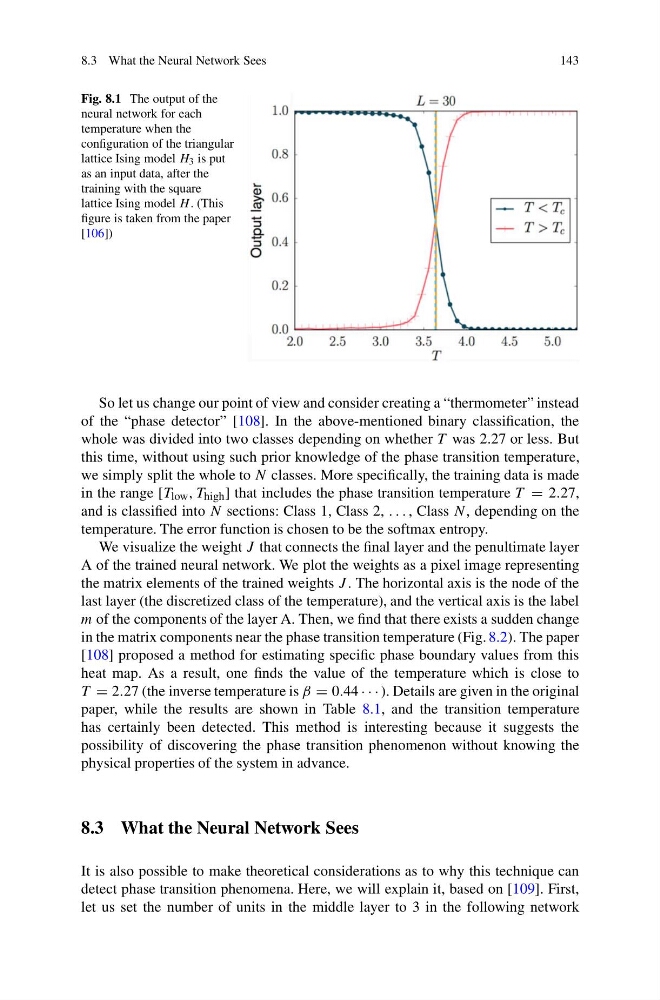
Fig. 8.1 The output of the
neural network for each
temperature when the
configuration of the triangular
lattice Ising model H 3 is put
as an input data, after the
training with the square
lattice Ising model H . (This
figure is taken from the paper
[106])
So let us change our point of view and consider creating a “thermometer” instead
of the “phase detector” [108]. In the above-mentioned binary classification, the
whole was divided into two classes depending on whether T was 2.27 or less. But
this time, without using such prior knowledge of the phase transition temperature,
we simply split the whole to N classes. More specifically, the training data is made
in the range [T low , T high ] that includes the phase transition temperature T = 2.27,
and is classified into N sections: Class 1, Class 2, . . . , Class N, depending on the
temperature. The error function is chosen to be the softmax entropy.
We visualize the weight J that connects the final layer and the penultimate layer
A of the trained neural network. We plot the weights as a pixel image representing
the matrix elements of the trained weights J . The horizontal axis is the node of the
last layer (the discretized class of the temperature), and the vertical axis is the label
m of the components of the layer A. Then, we find that there exists a sudden change
in the matrix components near the phase transition temperature (Fig. 8.2). The paper
[108] proposed a method for estimating specific phase boundary values from this
heat map. As a result, one finds the value of the temperature which is close to
T = 2.27 (the inverse temperature is β = 0.44 · · · ). Details are given in the original
paper, while the results are shown in Table 8.1, and the transition temperature
has certainly been detected. This method is interesting because it suggests the
possibility of discovering the phase transition phenomenon without knowing the
physical properties of the system in advance.
8.3 What the Neural Network Sees
It is also possible to make theoretical considerations as to why this technique can
detect phase transition phenomena. Here, we will explain it, based on [109]. First,
let us set the number of units in the middle layer to 3 in the following network
143
Fig. 8.1 The output of the
neural network for each
temperature when the
configuration of the triangular
lattice Ising model H 3 is put
as an input data, after the
training with the square
lattice Ising model H . (This
figure is taken from the paper
[106])
So let us change our point of view and consider creating a “thermometer” instead
of the “phase detector” [108]. In the above-mentioned binary classification, the
whole was divided into two classes depending on whether T was 2.27 or less. But
this time, without using such prior knowledge of the phase transition temperature,
we simply split the whole to N classes. More specifically, the training data is made
in the range [T low , T high ] that includes the phase transition temperature T = 2.27,
and is classified into N sections: Class 1, Class 2, . . . , Class N, depending on the
temperature. The error function is chosen to be the softmax entropy.
We visualize the weight J that connects the final layer and the penultimate layer
A of the trained neural network. We plot the weights as a pixel image representing
the matrix elements of the trained weights J . The horizontal axis is the node of the
last layer (the discretized class of the temperature), and the vertical axis is the label
m of the components of the layer A. Then, we find that there exists a sudden change
in the matrix components near the phase transition temperature (Fig. 8.2). The paper
[108] proposed a method for estimating specific phase boundary values from this
heat map. As a result, one finds the value of the temperature which is close to
T = 2.27 (the inverse temperature is β = 0.44 · · · ). Details are given in the original
paper, while the results are shown in Table 8.1, and the transition temperature
has certainly been detected. This method is interesting because it suggests the
possibility of discovering the phase transition phenomenon without knowing the
physical properties of the system in advance.
8.3 What the Neural Network Sees
It is also possible to make theoretical considerations as to why this technique can
detect phase transition phenomena. Here, we will explain it, based on [109]. First,
let us set the number of units in the middle layer to 3 in the following network