

48
Table 5.2 shows the volume of CO 2 reduction. Bioethanol also emits CO 2 through
its life cycle. There is no consensus how much CO 2 is reduced by substituting gasoline with bioethanol as a whole. Some studies insist the use of bioethanol rather than
increase new CO 2 . However, we adopt the following formula here.
CO
Eth
2
9 99 25400
=
´
. /
,
where CO 2 is the amount of reduction (million tons). The coefficient 9.99/25,400 is
the conversion rate from corn consumption for bioethanol production (1000 tons) to
CO 2 reduction (million tons). Because the amount of CO 2 reduction is proportional
to bioethanol consumption, it increases as the tax credit becomes larger (Table 5.3).
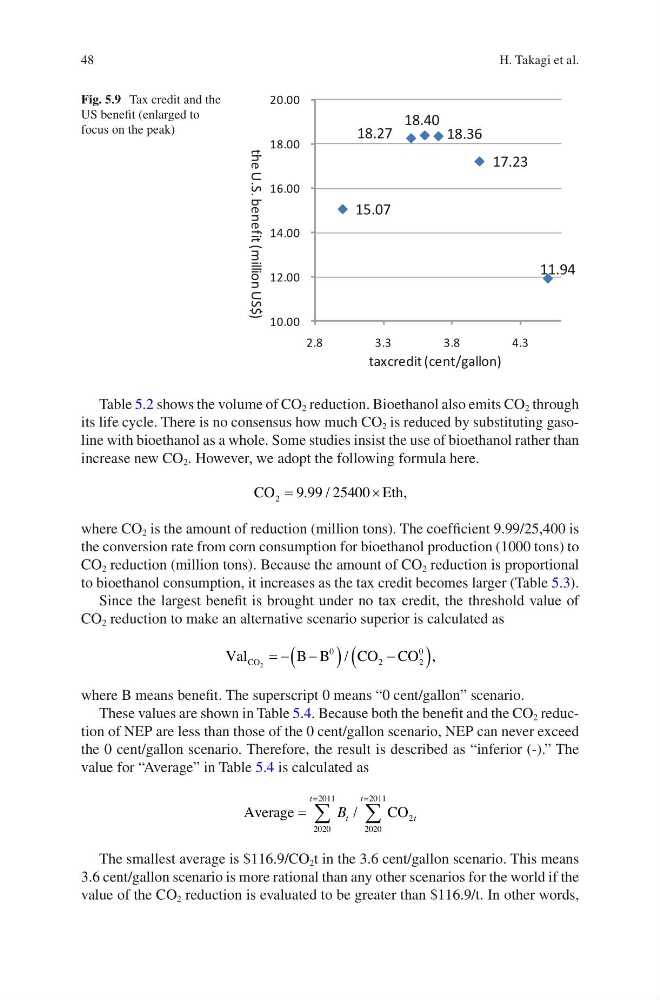
Since the largest benefit is brought under no tax credit, the threshold value of
CO 2 reduction to make an alternative scenario superior is calculated as
Val
B B
CO CO
CO 2
0
2
2
0
= - -
(
)
-
(
)
/
,
where B means benefit. The superscript 0 means “0 cent/gallon” scenario.
These values are shown in Table 5.4. Because both the benefit and the CO 2 reduction of NEP are less than those of the 0 cent/gallon scenario, NEP can never exceed
the 0 cent/gallon scenario. Therefore, the result is described as “inferior (-).” The
value for “Average” in Table 5.4 is calculated as
Average
C O
= å
å
=
=
2020
2011
2020
2011
2
t
t
t
t
B /
The smallest average is $116.9/CO 2 t in the 3.6 cent/gallon scenario. This means
3.6 cent/gallon scenario is more rational than any other scenarios for the world if the
value of the CO 2 reduction is evaluated to be greater than $116.9/t. In other words,
15.07
18.27
18.40 18.36
17.23
11.94
10.00
12.00
14.00
16.00
18.00
20.00
2.8
3 .3
3.8
4 .3
taxcredit (cent/gallon)
)
$
S
U
n
o
i
l
l
i
m
(
t
i
f
e
n
e
b
.
S
.
U
e
h
t
Fig. 5.9 Tax credit and the
US benefit (enlarged to
focus on the peak)
H. Takagi et al.
Table 5.2 shows the volume of CO 2 reduction. Bioethanol also emits CO 2 through
its life cycle. There is no consensus how much CO 2 is reduced by substituting gasoline with bioethanol as a whole. Some studies insist the use of bioethanol rather than
increase new CO 2 . However, we adopt the following formula here.
CO
Eth
2
9 99 25400
=
´
. /
,
where CO 2 is the amount of reduction (million tons). The coefficient 9.99/25,400 is
the conversion rate from corn consumption for bioethanol production (1000 tons) to
CO 2 reduction (million tons). Because the amount of CO 2 reduction is proportional
to bioethanol consumption, it increases as the tax credit becomes larger (Table 5.3).
Since the largest benefit is brought under no tax credit, the threshold value of
CO 2 reduction to make an alternative scenario superior is calculated as
Val
B B
CO CO
CO 2
0
2
2
0
= - -
(
)
-
(
)
/
,
where B means benefit. The superscript 0 means “0 cent/gallon” scenario.
These values are shown in Table 5.4. Because both the benefit and the CO 2 reduction of NEP are less than those of the 0 cent/gallon scenario, NEP can never exceed
the 0 cent/gallon scenario. Therefore, the result is described as “inferior (-).” The
value for “Average” in Table 5.4 is calculated as
Average
C O
= å
å
=
=
2020
2011
2020
2011
2
t
t
t
t
B /
The smallest average is $116.9/CO 2 t in the 3.6 cent/gallon scenario. This means
3.6 cent/gallon scenario is more rational than any other scenarios for the world if the
value of the CO 2 reduction is evaluated to be greater than $116.9/t. In other words,
15.07
18.27
18.40 18.36
17.23
11.94
10.00
12.00
14.00
16.00
18.00
20.00
2.8
3 .3
3.8
4 .3
taxcredit (cent/gallon)
)
$
S
U
n
o
i
l
l
i
m
(
t
i
f
e
n
e
b
.
S
.
U
e
h
t
Fig. 5.9 Tax credit and the
US benefit (enlarged to
focus on the peak)
H. Takagi et al.