

17
1.3.3.3 Results
1.3.3.3.1 Budapest
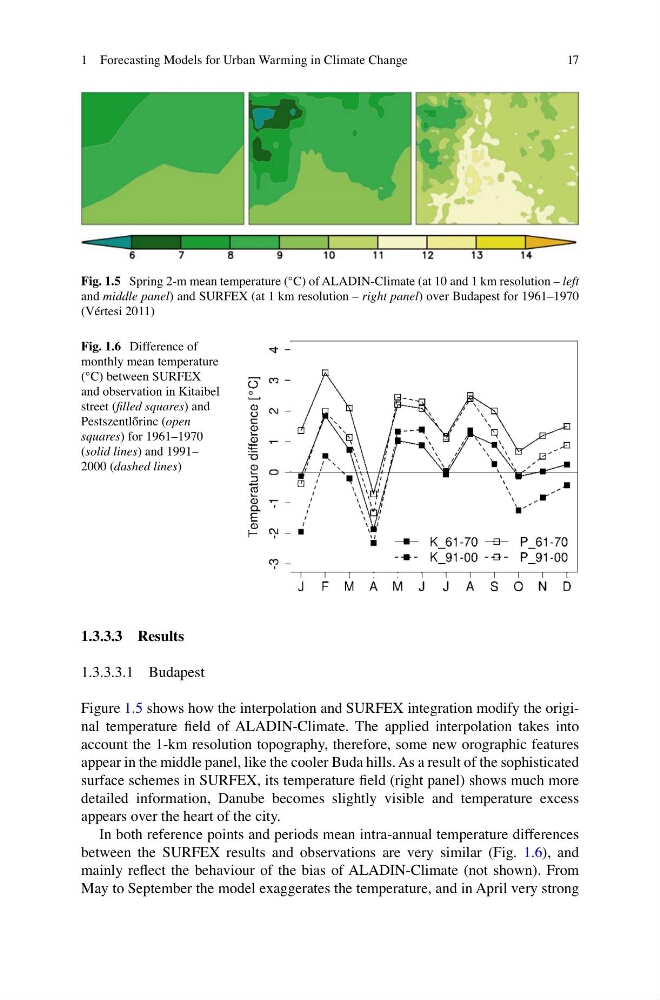
Figure 1.5 shows how the interpolation and SURFEX integration modify the original temperature field of ALADIN-Climate. The applied interpolation takes into
account the 1-km resolution topography, therefore, some new orographic features
appear in the middle panel, like the cooler Buda hills. As a result of the sophisticated
surface schemes in SURFEX, its temperature field (right panel) shows much more
detailed information, Danube becomes slightly visible and temperature excess
appears over the heart of the city.
In both reference points and periods mean intra-annual temperature differences
between the SURFEX results and observations are very similar (Fig. 1.6), and
mainly reflect the behaviour of the bias of ALADIN-Climate (not shown). From
May to September the model exaggerates the temperature, and in April very strong
Fig. 1.5 Spring 2-m mean temperature (°C) of ALADIN-Climate (at 10 and 1 km resolution – left
and middle panel) and SURFEX (at 1 km resolution – right panel) over Budapest for 1961–1970
(Vértesi 2011)
Fig. 1.6 Difference of
monthly mean temperature
(°C) between SURFEX
and observation in Kitaibel
street (filled squares) and
Pestszentlőrinc (open
squares) for 1961–1970
(solid lines) and 1991–
2000 (dashed lines)
1 Forecasting Models for Urban Warming in Climate Change
1.3.3.3 Results
1.3.3.3.1 Budapest
Figure 1.5 shows how the interpolation and SURFEX integration modify the original temperature field of ALADIN-Climate. The applied interpolation takes into
account the 1-km resolution topography, therefore, some new orographic features
appear in the middle panel, like the cooler Buda hills. As a result of the sophisticated
surface schemes in SURFEX, its temperature field (right panel) shows much more
detailed information, Danube becomes slightly visible and temperature excess
appears over the heart of the city.
In both reference points and periods mean intra-annual temperature differences
between the SURFEX results and observations are very similar (Fig. 1.6), and
mainly reflect the behaviour of the bias of ALADIN-Climate (not shown). From
May to September the model exaggerates the temperature, and in April very strong
Fig. 1.5 Spring 2-m mean temperature (°C) of ALADIN-Climate (at 10 and 1 km resolution – left
and middle panel) and SURFEX (at 1 km resolution – right panel) over Budapest for 1961–1970
(Vértesi 2011)
Fig. 1.6 Difference of
monthly mean temperature
(°C) between SURFEX
and observation in Kitaibel
street (filled squares) and
Pestszentlőrinc (open
squares) for 1961–1970
(solid lines) and 1991–
2000 (dashed lines)
1 Forecasting Models for Urban Warming in Climate Change