

13
Table 1.3 The average annual air temperature simulated by the ENSEMBLE models RT2B and
the standard deviation in the greater region of Stuttgart from 1961–1990 to 2021–2050 and
2071–2100
Air temperature
1961–1990
2021–2050
2071–2100
Yearly
7.9 ± 1.7
9.4 ± 1.8
11.4 ± 2.1
Spring
6.7 ± 2.0
7.8 ± 2.3
9.6 ± 2.0
Summer
16.5 ± 2.5
18.0 ± 2.7
20.5 ± 3.4
Autumn
8.3 ± 1.8
9.7 ± 1.8
11.8 ± 2.4
Winter
0.1 ± 2.1
1.8 ± 2.1
3.8 ± 2.1
Table 1.2 Analysis of the number of climatological event days in the greater area of Stuttgart
using the ENSEMBLE model RT2B for three different time periods 1961–1990, 2021–2050 and
2071–2100
Event
1961–1990
2021–2050
2071–2100
Extreme hot days
Ta max ≥ 39 °C
0 ± 1
1 ± 2
3 ± 5
Hot days
Ta max ≥ 30 °C
7 ± 9
12 ± 14
20 ± 24
Summer days
Ta max ≥ 25 °C
27 ± 19
37 ± 22
42 ± 38
Frost days
Ta min ≤ 0 °C
104 ± 29
79 ± 27
35 ± 30
Ice days
Ta mix ≤ °C
30 ± 13
18 ± 10
7 ± 8
Extreme cold days
Ta max ≤ −10 °C
1 ± 1
±0
± 0
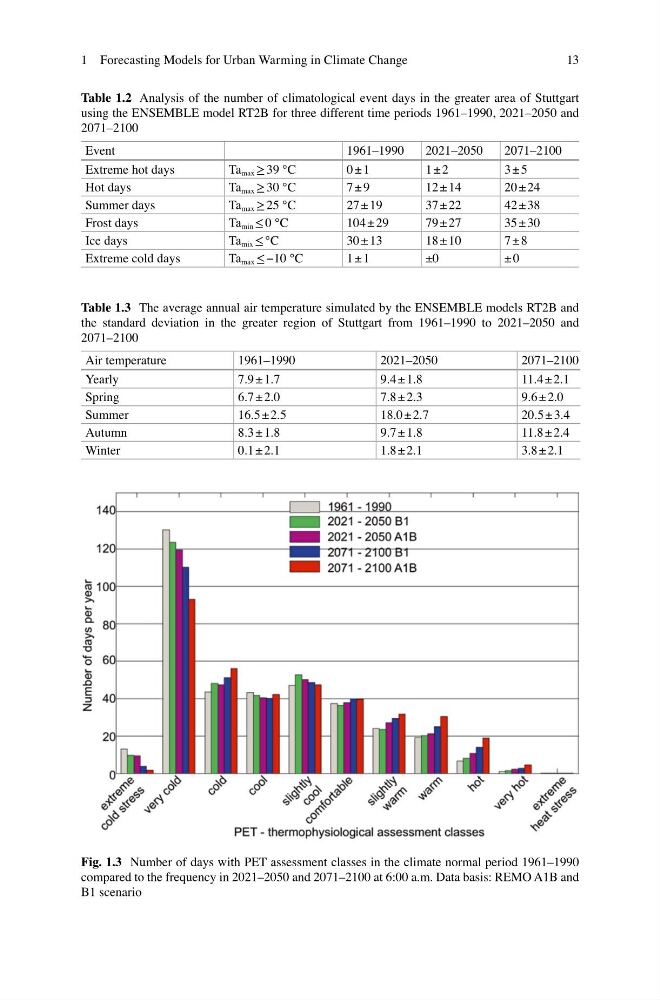
Fig. 1.3 Number of days with PET assessment classes in the climate normal period 1961–1990
compared to the frequency in 2021–2050 and 2071–2100 at 6:00 a.m. Data basis: REMO A1B and
B1 scenario
1 Forecasting Models for Urban Warming in Climate Change
Table 1.3 The average annual air temperature simulated by the ENSEMBLE models RT2B and
the standard deviation in the greater region of Stuttgart from 1961–1990 to 2021–2050 and
2071–2100
Air temperature
1961–1990
2021–2050
2071–2100
Yearly
7.9 ± 1.7
9.4 ± 1.8
11.4 ± 2.1
Spring
6.7 ± 2.0
7.8 ± 2.3
9.6 ± 2.0
Summer
16.5 ± 2.5
18.0 ± 2.7
20.5 ± 3.4
Autumn
8.3 ± 1.8
9.7 ± 1.8
11.8 ± 2.4
Winter
0.1 ± 2.1
1.8 ± 2.1
3.8 ± 2.1
Table 1.2 Analysis of the number of climatological event days in the greater area of Stuttgart
using the ENSEMBLE model RT2B for three different time periods 1961–1990, 2021–2050 and
2071–2100
Event
1961–1990
2021–2050
2071–2100
Extreme hot days
Ta max ≥ 39 °C
0 ± 1
1 ± 2
3 ± 5
Hot days
Ta max ≥ 30 °C
7 ± 9
12 ± 14
20 ± 24
Summer days
Ta max ≥ 25 °C
27 ± 19
37 ± 22
42 ± 38
Frost days
Ta min ≤ 0 °C
104 ± 29
79 ± 27
35 ± 30
Ice days
Ta mix ≤ °C
30 ± 13
18 ± 10
7 ± 8
Extreme cold days
Ta max ≤ −10 °C
1 ± 1
±0
± 0
Fig. 1.3 Number of days with PET assessment classes in the climate normal period 1961–1990
compared to the frequency in 2021–2050 and 2071–2100 at 6:00 a.m. Data basis: REMO A1B and
B1 scenario
1 Forecasting Models for Urban Warming in Climate Change