

377
values around 37 °C (Fig. 14.5), with differences among different parts of the city
being maximal about 2 °C. PET values (Fig. 14.6) on that day reached over 46 °C
in the city centre, with difference through the city being a bit higher compared to the
differences in the air temperatures. Values of PET over 40 °C started already around
9 in the morning and continued to 5 in the afternoon. Especially in the evening, the
differences between city centre and periphery exceeded 8 °C.
14.1.3 Air-Quality Issues
Mária Kazmuková
Prague Institute of Planning and Development, Prague, Czech Republic
Peter Huszár and Tomáš Halenka
Faculty of Mathematics and Physics, Department of Atmospheric Physics,
Charles University Prague (CUNI), Prague, Czech Republic
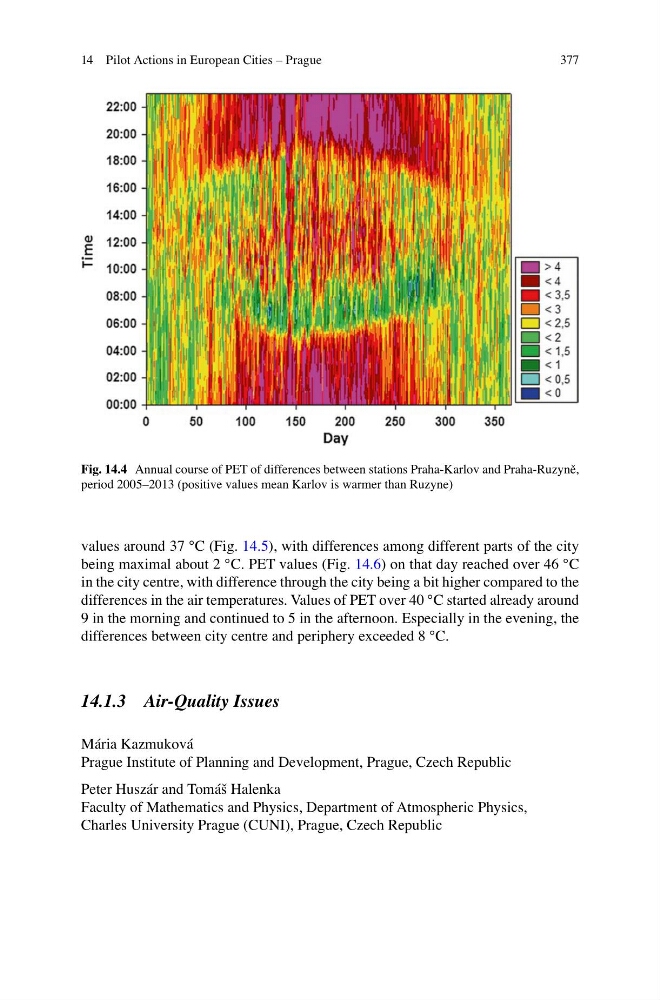
Fig. 14.4 Annual course of PET of differences between stations Praha-Karlov and Praha-Ruzyně,
period 2005–2013 (positive values mean Karlov is warmer than Ruzyne)
14 Pilot Actions in European Cities – Prague
values around 37 °C (Fig. 14.5), with differences among different parts of the city
being maximal about 2 °C. PET values (Fig. 14.6) on that day reached over 46 °C
in the city centre, with difference through the city being a bit higher compared to the
differences in the air temperatures. Values of PET over 40 °C started already around
9 in the morning and continued to 5 in the afternoon. Especially in the evening, the
differences between city centre and periphery exceeded 8 °C.
14.1.3 Air-Quality Issues
Mária Kazmuková
Prague Institute of Planning and Development, Prague, Czech Republic
Peter Huszár and Tomáš Halenka
Faculty of Mathematics and Physics, Department of Atmospheric Physics,
Charles University Prague (CUNI), Prague, Czech Republic
Fig. 14.4 Annual course of PET of differences between stations Praha-Karlov and Praha-Ruzyně,
period 2005–2013 (positive values mean Karlov is warmer than Ruzyne)
14 Pilot Actions in European Cities – Prague