

324
In Ljubljana, urban heat island was fi rst detected when creating The climate map
in 2000 (Fig. 12.1 ). Area with above-average temperatures was lying between the
Rožnik and Golovec hills (Rejec Brancelj et al. 2005 ; Smrekar et al. 2016 ). In the
context of climate map guidelines for spatial planning were prepared, which preserved the green wedges and fresh air corridors for the city centre (Internet 3 ).
During the UHI project we found that the development of the city and in particular the construction of many shopping centres with large parking places increased
the intensity of urban heat island phenomenon. The project was designed primarily
for mitigating as well as adapting to this phenomenon and thus climate change.
12.2 Meteorological Measurements
During the project the urban heat island index was calculated for the Ljubljana
Bežigrad (46 °07′ N, 14°52′ E, 299 m a.s.l.) and Brnik (46 °22′ N, 14°22′ E, 364 m
a.s.l.) meteorological stations (Internet 1 ). The Ljubljana Bežigrad weather station
is within the inner circle of the city. The area is representative for a typical urban
Ljubljana setting, 1.5 km away from the city centre. The weather station is a synoptic one and thus equipped with many for the UHI-recognition meteorological
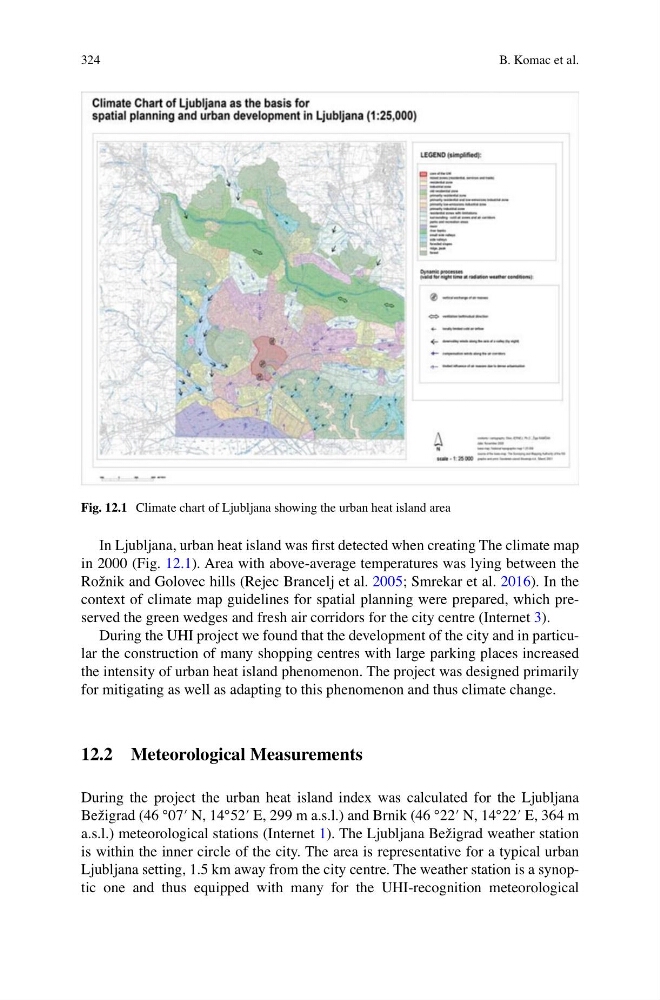
Fig. 12.1 Climate chart of Ljubljana showing the urban heat island area
B. Komac et al.
In Ljubljana, urban heat island was fi rst detected when creating The climate map
in 2000 (Fig. 12.1 ). Area with above-average temperatures was lying between the
Rožnik and Golovec hills (Rejec Brancelj et al. 2005 ; Smrekar et al. 2016 ). In the
context of climate map guidelines for spatial planning were prepared, which preserved the green wedges and fresh air corridors for the city centre (Internet 3 ).
During the UHI project we found that the development of the city and in particular the construction of many shopping centres with large parking places increased
the intensity of urban heat island phenomenon. The project was designed primarily
for mitigating as well as adapting to this phenomenon and thus climate change.
12.2 Meteorological Measurements
During the project the urban heat island index was calculated for the Ljubljana
Bežigrad (46 °07′ N, 14°52′ E, 299 m a.s.l.) and Brnik (46 °22′ N, 14°22′ E, 364 m
a.s.l.) meteorological stations (Internet 1 ). The Ljubljana Bežigrad weather station
is within the inner circle of the city. The area is representative for a typical urban
Ljubljana setting, 1.5 km away from the city centre. The weather station is a synoptic one and thus equipped with many for the UHI-recognition meteorological
Fig. 12.1 Climate chart of Ljubljana showing the urban heat island area
B. Komac et al.