

295
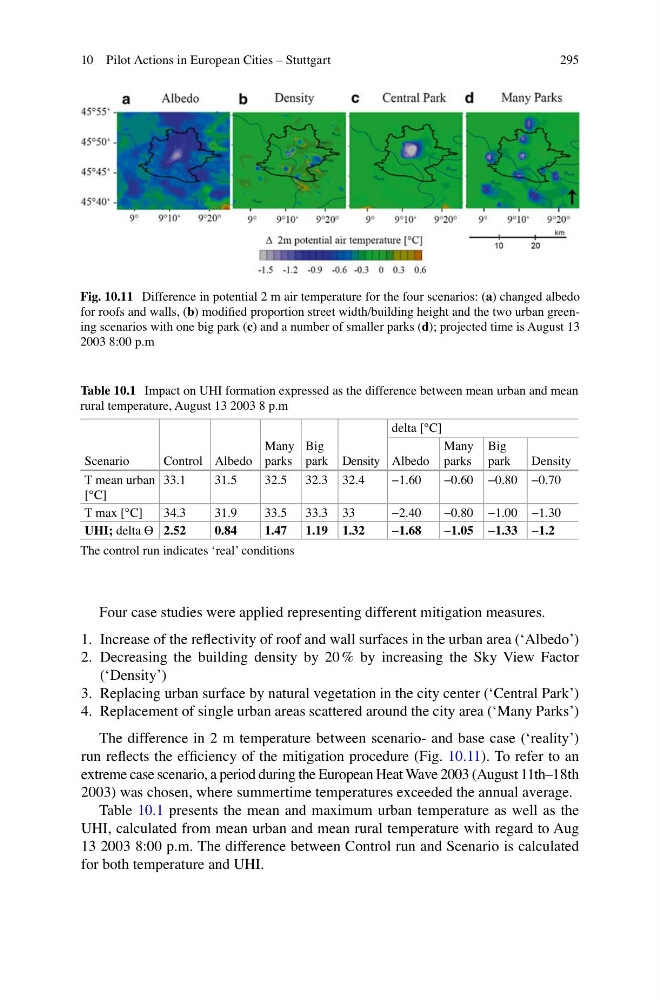
Four case studies were applied representing different mitigation measures.
1. Increase of the refl ectivity of roof and wall surfaces in the urban area (‘Albedo’)
2. Decreasing the building density by 20 % by increasing the Sky View Factor
(‘Density’)
3. Replacing urban surface by natural vegetation in the city center (‘Central Park’)
4. Replacement of single urban areas scattered around the city area (‘Many Parks’)
The difference in 2 m temperature between scenario- and base case (‘reality’)
run refl ects the effi ciency of the mitigation procedure (Fig. 10.11 ). To refer to an
extreme case scenario, a period during the European Heat Wave 2003 (August 11th–18th
2003) was chosen, where summertime temperatures exceeded the annual average.
Table 10.1 presents the mean and maximum urban temperature as well as the
UHI, calculated from mean urban and mean rural temperature with regard to Aug
13 2003 8:00 p.m. The difference between Control run and Scenario is calculated
for both temperature and UHI.
Fig. 10.11 Difference in potential 2 m air temperature for the four scenarios: ( a ) changed albedo
for roofs and walls, ( b ) modifi ed proportion street width/building height and the two urban greening scenarios with one big park ( c ) and a number of smaller parks ( d ); projected time is August 13
2003 8:00 p.m
Table 10.1 Impact on UHI formation expressed as the difference between mean urban and mean
rural temperature, August 13 2003 8 p.m
Scenario
Control Albedo
Many
parks
Big
park Density
delta [°C]
Albedo
Many
parks
Big
park
Density
T mean urban
[°C]
33.1
31.5
32.5 32.3 32.4
−1.60
−0.60 −0.80 −0.70
T max [°C]
34.3
31.9
33.5 33.3 33
−2.40
−0.80 −1.00 −1.30
UHI; delta ϴ 2.52
0.84
1.47 1.19 1.32
− 1.68
− 1.05 − 1.33 − 1.2
The control run indicates ‘real’ conditions
10 Pilot Actions in European Cities – Stuttgart
Four case studies were applied representing different mitigation measures.
1. Increase of the refl ectivity of roof and wall surfaces in the urban area (‘Albedo’)
2. Decreasing the building density by 20 % by increasing the Sky View Factor
(‘Density’)
3. Replacing urban surface by natural vegetation in the city center (‘Central Park’)
4. Replacement of single urban areas scattered around the city area (‘Many Parks’)
The difference in 2 m temperature between scenario- and base case (‘reality’)
run refl ects the effi ciency of the mitigation procedure (Fig. 10.11 ). To refer to an
extreme case scenario, a period during the European Heat Wave 2003 (August 11th–18th
2003) was chosen, where summertime temperatures exceeded the annual average.
Table 10.1 presents the mean and maximum urban temperature as well as the
UHI, calculated from mean urban and mean rural temperature with regard to Aug
13 2003 8:00 p.m. The difference between Control run and Scenario is calculated
for both temperature and UHI.
Fig. 10.11 Difference in potential 2 m air temperature for the four scenarios: ( a ) changed albedo
for roofs and walls, ( b ) modifi ed proportion street width/building height and the two urban greening scenarios with one big park ( c ) and a number of smaller parks ( d ); projected time is August 13
2003 8:00 p.m
Table 10.1 Impact on UHI formation expressed as the difference between mean urban and mean
rural temperature, August 13 2003 8 p.m
Scenario
Control Albedo
Many
parks
Big
park Density
delta [°C]
Albedo
Many
parks
Big
park
Density
T mean urban
[°C]
33.1
31.5
32.5 32.3 32.4
−1.60
−0.60 −0.80 −0.70
T max [°C]
34.3
31.9
33.5 33.3 33
−2.40
−0.80 −1.00 −1.30
UHI; delta ϴ 2.52
0.84
1.47 1.19 1.32
− 1.68
− 1.05 − 1.33 − 1.2
The control run indicates ‘real’ conditions
10 Pilot Actions in European Cities – Stuttgart