

263
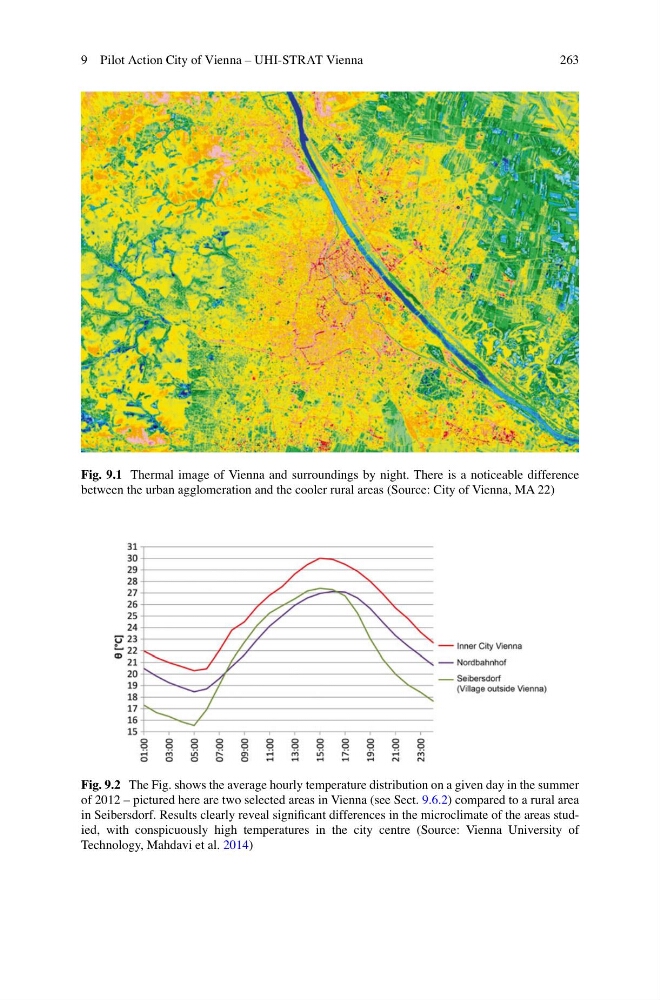
Fig. 9.1 Thermal image of Vienna and surroundings by night. There is a noticeable difference
between the urban agglomeration and the cooler rural areas (Source: City of Vienna, MA 22)
Fig. 9.2 The Fig. shows the average hourly temperature distribution on a given day in the summer
of 2012 – pictured here are two selected areas in Vienna (see Sect. 9.6.2 ) compared to a rural area
in Seibersdorf. Results clearly reveal signifi cant differences in the microclimate of the areas studied, with conspicuously high temperatures in the city centre (Source: Vienna University of
Technology, Mahdavi et al. 2014 )
9 Pilot Action City of Vienna – UHI-STRAT Vienna
Fig. 9.1 Thermal image of Vienna and surroundings by night. There is a noticeable difference
between the urban agglomeration and the cooler rural areas (Source: City of Vienna, MA 22)
Fig. 9.2 The Fig. shows the average hourly temperature distribution on a given day in the summer
of 2012 – pictured here are two selected areas in Vienna (see Sect. 9.6.2 ) compared to a rural area
in Seibersdorf. Results clearly reveal signifi cant differences in the microclimate of the areas studied, with conspicuously high temperatures in the city centre (Source: Vienna University of
Technology, Mahdavi et al. 2014 )
9 Pilot Action City of Vienna – UHI-STRAT Vienna