

101
2003 had many negative effects on human health, which results in high mortality
and morbidity rate in Western Europe (Koppe et al. 2003; Le Tertre et al. 2006). The
daytime PET values are higher than Ta during the day. During the night, PET is
lower than air temperature. During the winter, the values of air temperature are
mostly higher than the values of PET, due to the effect of wind, low irradiation and
air humidity.
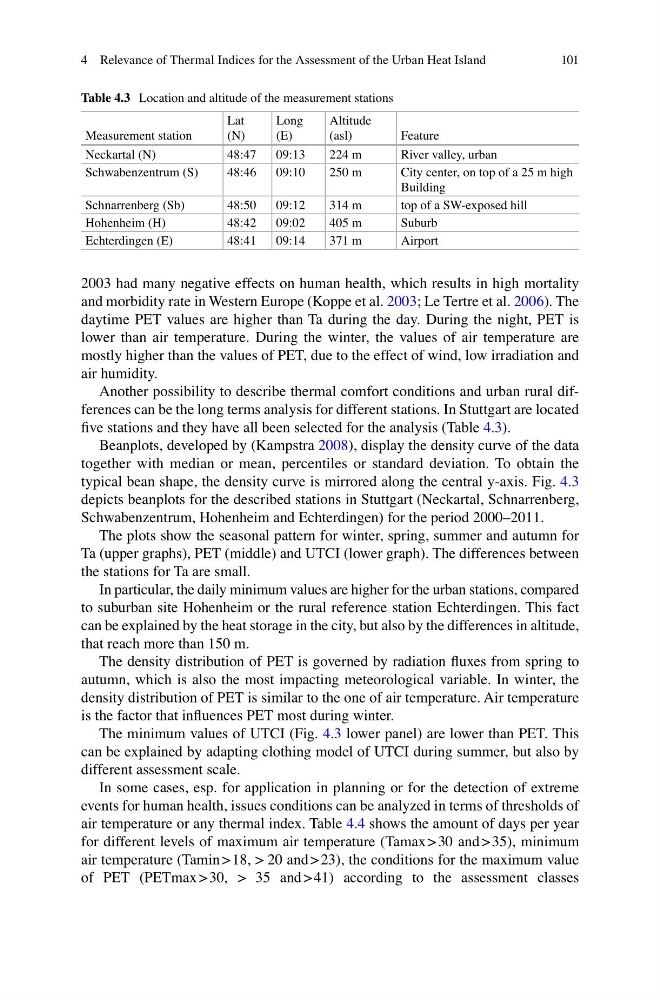
Another possibility to describe thermal comfort conditions and urban rural differences can be the long terms analysis for different stations. In Stuttgart are located
five stations and they have all been selected for the analysis (Table 4.3).
Beanplots, developed by (Kampstra 2008), display the density curve of the data
together with median or mean, percentiles or standard deviation. To obtain the
typical bean shape, the density curve is mirrored along the central y-axis. Fig. 4.3
depicts beanplots for the described stations in Stuttgart (Neckartal, Schnarrenberg,
Schwabenzentrum, Hohenheim and Echterdingen) for the period 2000–2011.
The plots show the seasonal pattern for winter, spring, summer and autumn for
Ta (upper graphs), PET (middle) and UTCI (lower graph). The differences between
the stations for Ta are small.
In particular, the daily minimum values are higher for the urban stations, compared
to suburban site Hohenheim or the rural reference station Echterdingen. This fact
can be explained by the heat storage in the city, but also by the differences in altitude,
that reach more than 150 m.
The density distribution of PET is governed by radiation fluxes from spring to
autumn, which is also the most impacting meteorological variable. In winter, the
density distribution of PET is similar to the one of air temperature. Air temperature
is the factor that influences PET most during winter.
The minimum values of UTCI (Fig. 4.3 lower panel) are lower than PET. This
can be explained by adapting clothing model of UTCI during summer, but also by
different assessment scale.
In some cases, esp. for application in planning or for the detection of extreme
events for human health, issues conditions can be analyzed in terms of thresholds of
air temperature or any thermal index. Table 4.4 shows the amount of days per year
for different levels of maximum air temperature (Tamax > 30 and > 35), minimum
air temperature (Tamin > 18, > 20 and > 23), the conditions for the maximum value
of PET (PETmax > 30, > 35 and > 41) according to the assessment classes
Table 4.3 Location and altitude of the measurement stations
Measurement station
Lat
(N)
Long
(E)
Altitude
(asl)
Feature
Neckartal (N)
48:47
09:13
224 m
River valley, urban
Schwabenzentrum (S)
48:46
09:10
250 m
City center, on top of a 25 m high
Building
Schnarrenberg (Sb)
48:50
09:12
314 m
top of a SW-exposed hill
Hohenheim (H)
48:42
09:02
405 m
Suburb
Echterdingen (E)
48:41
09:14
371 m
Airport
4 Relevance of Thermal Indices for the Assessment of the Urban Heat Island
2003 had many negative effects on human health, which results in high mortality
and morbidity rate in Western Europe (Koppe et al. 2003; Le Tertre et al. 2006). The
daytime PET values are higher than Ta during the day. During the night, PET is
lower than air temperature. During the winter, the values of air temperature are
mostly higher than the values of PET, due to the effect of wind, low irradiation and
air humidity.
Another possibility to describe thermal comfort conditions and urban rural differences can be the long terms analysis for different stations. In Stuttgart are located
five stations and they have all been selected for the analysis (Table 4.3).
Beanplots, developed by (Kampstra 2008), display the density curve of the data
together with median or mean, percentiles or standard deviation. To obtain the
typical bean shape, the density curve is mirrored along the central y-axis. Fig. 4.3
depicts beanplots for the described stations in Stuttgart (Neckartal, Schnarrenberg,
Schwabenzentrum, Hohenheim and Echterdingen) for the period 2000–2011.
The plots show the seasonal pattern for winter, spring, summer and autumn for
Ta (upper graphs), PET (middle) and UTCI (lower graph). The differences between
the stations for Ta are small.
In particular, the daily minimum values are higher for the urban stations, compared
to suburban site Hohenheim or the rural reference station Echterdingen. This fact
can be explained by the heat storage in the city, but also by the differences in altitude,
that reach more than 150 m.
The density distribution of PET is governed by radiation fluxes from spring to
autumn, which is also the most impacting meteorological variable. In winter, the
density distribution of PET is similar to the one of air temperature. Air temperature
is the factor that influences PET most during winter.
The minimum values of UTCI (Fig. 4.3 lower panel) are lower than PET. This
can be explained by adapting clothing model of UTCI during summer, but also by
different assessment scale.
In some cases, esp. for application in planning or for the detection of extreme
events for human health, issues conditions can be analyzed in terms of thresholds of
air temperature or any thermal index. Table 4.4 shows the amount of days per year
for different levels of maximum air temperature (Tamax > 30 and > 35), minimum
air temperature (Tamin > 18, > 20 and > 23), the conditions for the maximum value
of PET (PETmax > 30, > 35 and > 41) according to the assessment classes
Table 4.3 Location and altitude of the measurement stations
Measurement station
Lat
(N)
Long
(E)
Altitude
(asl)
Feature
Neckartal (N)
48:47
09:13
224 m
River valley, urban
Schwabenzentrum (S)
48:46
09:10
250 m
City center, on top of a 25 m high
Building
Schnarrenberg (Sb)
48:50
09:12
314 m
top of a SW-exposed hill
Hohenheim (H)
48:42
09:02
405 m
Suburb
Echterdingen (E)
48:41
09:14
371 m
Airport
4 Relevance of Thermal Indices for the Assessment of the Urban Heat Island