

98
environment. Both meteorological and non-meteorological (metabolic rate and
thermal resistance of clothing) reference conditions were defined:
• wind speed (v) of 0.5 m/s at 10 m height (approximately 0.3 m/s in 1.1 m),
• mean radiant temperature (Tmrt) equal to air temperature,
• vapor pressure (VP) that represent relative humidity of 50 %, at high air temperatures (>29 °C) the reference air humidity is defined as 20 hPa.
• representative activity to be that of a person walking with a speed of 4 km/h
(1.1 m/s). This provides a metabolic rate of 2.3 MET (135 W/m
2 ).
The adjustment of clothing insulation is a powerful behavioral response to changing atmospheric conditions. Thereby, the conception behind UTCI was to consider
seasonal clothing adaptation habits of Europeans based on available data from field
surveys, in order to obtain a realistic representation of this behavioral action.
The categorization of UTCI is based on physiological response of an organism at
actual environmental conditions depending on the responses for the reference conditions and thermal load (ie heat or cold stress) (Table 4.2). UTCI values between
18 and 26 °C may comply closely with the definition of the “thermal comfort zone”
supplied in the Glossary of Terms for Thermal Physiology (International Union of
Physiological Sciences – Thermal Commission 2003) as: “The range of ambient
temperatures, associated with specified mean radiant temperature, humidity, and air
movement, within which a human in specified clothing expresses indifference to the
thermal environment for an indefinite period”.
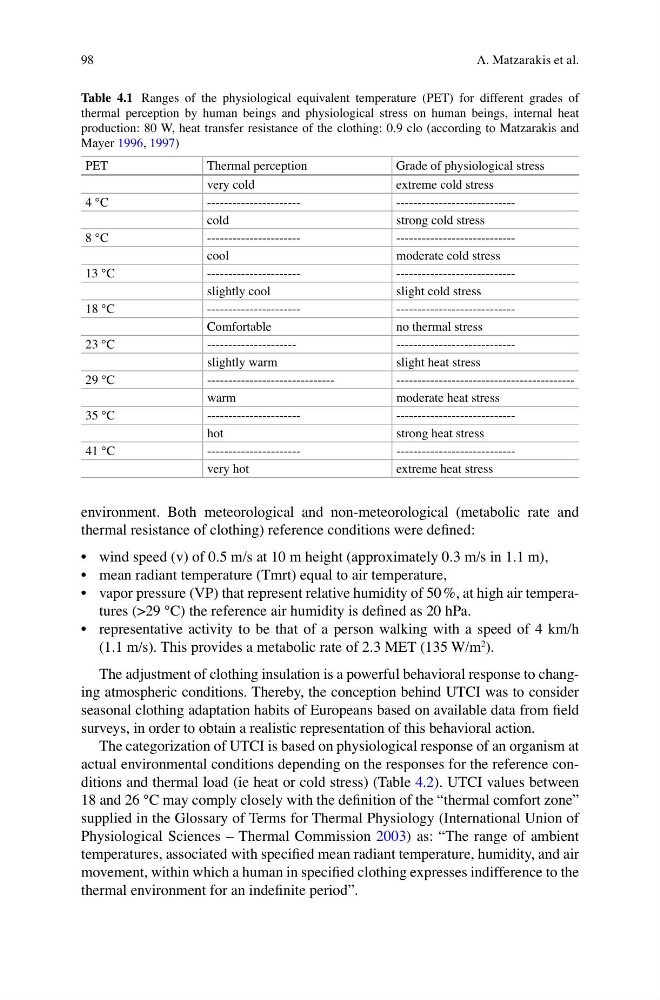
Table 4.1 Ranges of the physiological equivalent temperature (PET) for different grades of
thermal perception by human beings and physiological stress on human beings, internal heat
production: 80 W, heat transfer resistance of the clothing: 0.9 clo (according to Matzarakis and
Mayer 1996, 1997)
PET
Thermal perception
Grade of physiological stress
very cold
extreme cold stress
4 °C
---------------------------cold
strong cold stress
8 °C
---------------------------cool
moderate cold stress
13 °C
---------------------------slightly cool
slight cold stress
18 °C
---------------------------Comfortable
no thermal stress
23 °C
---------------------------slightly warm
slight heat stress
29 °C
-----------------------------------------warm
moderate heat stress
35 °C
---------------------------hot
strong heat stress
41 °C
---------------------------very hot
extreme heat stress
A. Matzarakis et al.
environment. Both meteorological and non-meteorological (metabolic rate and
thermal resistance of clothing) reference conditions were defined:
• wind speed (v) of 0.5 m/s at 10 m height (approximately 0.3 m/s in 1.1 m),
• mean radiant temperature (Tmrt) equal to air temperature,
• vapor pressure (VP) that represent relative humidity of 50 %, at high air temperatures (>29 °C) the reference air humidity is defined as 20 hPa.
• representative activity to be that of a person walking with a speed of 4 km/h
(1.1 m/s). This provides a metabolic rate of 2.3 MET (135 W/m
2 ).
The adjustment of clothing insulation is a powerful behavioral response to changing atmospheric conditions. Thereby, the conception behind UTCI was to consider
seasonal clothing adaptation habits of Europeans based on available data from field
surveys, in order to obtain a realistic representation of this behavioral action.
The categorization of UTCI is based on physiological response of an organism at
actual environmental conditions depending on the responses for the reference conditions and thermal load (ie heat or cold stress) (Table 4.2). UTCI values between
18 and 26 °C may comply closely with the definition of the “thermal comfort zone”
supplied in the Glossary of Terms for Thermal Physiology (International Union of
Physiological Sciences – Thermal Commission 2003) as: “The range of ambient
temperatures, associated with specified mean radiant temperature, humidity, and air
movement, within which a human in specified clothing expresses indifference to the
thermal environment for an indefinite period”.
Table 4.1 Ranges of the physiological equivalent temperature (PET) for different grades of
thermal perception by human beings and physiological stress on human beings, internal heat
production: 80 W, heat transfer resistance of the clothing: 0.9 clo (according to Matzarakis and
Mayer 1996, 1997)
PET
Thermal perception
Grade of physiological stress
very cold
extreme cold stress
4 °C
---------------------------cold
strong cold stress
8 °C
---------------------------cool
moderate cold stress
13 °C
---------------------------slightly cool
slight cold stress
18 °C
---------------------------Comfortable
no thermal stress
23 °C
---------------------------slightly warm
slight heat stress
29 °C
-----------------------------------------warm
moderate heat stress
35 °C
---------------------------hot
strong heat stress
41 °C
---------------------------very hot
extreme heat stress
A. Matzarakis et al.