

58
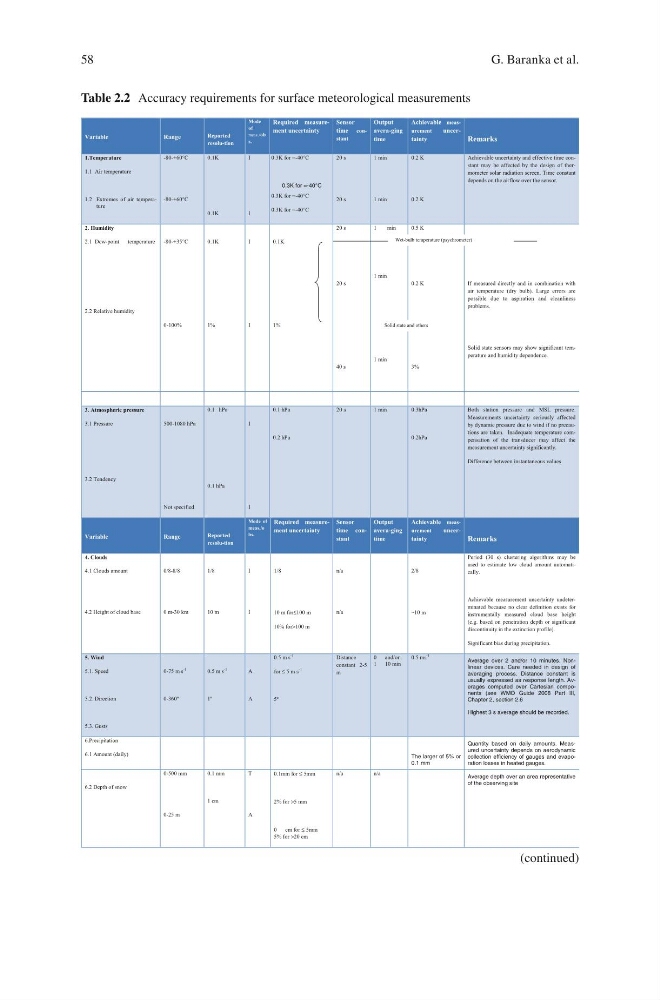
Table 2.2 Accuracy requirements for surface meteorological measurements
Variable
Range
Reported
resolu-tion
Mode
of
meas./ob
s.
Required measurement uncertainty
Sensor
time constant
Output
avera-ging
time
Achievable measurement
uncertainty
Remarks
1.Temperature
1.1 Air temperature
1.2 Extremes of air temperature
-80-+60°C
-80-+60°C
0.1K
0.1K
I
I
0.3K for =-40°C
0.3K for =-40°C
0.3K for =-40°C
0.3K for =-40°C
20 s
20 s
1 min
1 min
0.2 K
0.2 K
Achievable uncertainty and effective time constant may be affected by the design of thermometer solar radiation screen. Time constant
depends on the airflow over the sensor.
2. Humidity
2.1 Dew-point
temperature
2.2 Relative humidity
-80-+35°C
0-100%
0.1K
1%
I
I
0.1K
1%
20 s
20 s
40 s
1
m in
1 min
1 min
0.5 K
0.2 K
3%
If measured directly and in combination with
air temperature (dry bulb). Large errors are
possible due to aspiration and cleanliness
problems.
Solid state sensors may show significant temperature and humidity dependence.
Wet-bulb temperature (psychrometer)
Solid state and others
3. Atmospheric pressure
3.1 Pressure
3.2 Tendency
500-1080 hPa
Not specified
0.1 hPa
0.1 hPa
I
I
0.1 hPa
0.2 hPa
20 s
1 min
0.3hPa
0.2hPa
Both station pressure and MSL pressure.
Measurements uncertainty seriously affected
by dynamic pressure due to wind if no precautions are taken. Inadequate temperature compensation of the transducer may affect the
measurement uncertainty significantly.
Difference between instantaneous values
Variable
Range
Reported
resolu-tion
Mode of
meas./o
bs.
Required measurement uncertainty
Sensor
time constant
Output
avera-ging
time
Achievable measurement
uncertainty
Remarks
4. Clouds
4.1 Clouds amount
4.2 Height of cloud base
0/8-8/8
0 m-30 km
1/8
10 m
I
I
1/8
10 m for≤100 m
10% for>100 m
n/a
n/a
2/8
~10 m
Period (30 s) clustering algorithms may be
used to estimate low cloud amount automatically.
Achievable measurement uncertainty undeterminated because no clear definition exists for
instrumentally measured cloud base height
(e.g. based on penetration depth or significant
discontinuity in the extinction profile).
Significant bias during precipitation.
5. Wind
5.1. Speed
5.2. Direction
5.3. Gusts
0-75 m s -1
0-360º
0.5 m s -1
1º
A
A
0.5 m s -1
for ≤ 5 m s -1
5º
Distance
constant 2-5
m
0 a nd/or
1 1 0 min
0.5 ms -1
Average over 2 and/or 10 minutes. Nonlinear devices. Care needed in design of
averaging process. Distance constant is
usually expressed as response length. Averages computed over Cartesian components (see WMO Guide 2008 Part III,
Chapter 2, section 2.6
Highest 3 s average should be recorded.
6.Precipitation
6.1 Amount (daily)
The larger of 5% or
0.1 mm
Quantity based on daily amounts. Measured uncertainty depends on aerodynamic
collection efficiency of gauges and evaporation losses in heated gauges.
6.2 Depth of snow
0-500 mm
0-25 m
0.1 mm
1 cm
T
A
0.1mm for ≤ 5mm
2% for >5 mm
0
c m for ≤ 5mm
5% for >20 cm
n/a
n /a
Average depth over an area representative
of the observing site
(continued)
G. Baranka et al.
Table 2.2 Accuracy requirements for surface meteorological measurements
Variable
Range
Reported
resolu-tion
Mode
of
meas./ob
s.
Required measurement uncertainty
Sensor
time constant
Output
avera-ging
time
Achievable measurement
uncertainty
Remarks
1.Temperature
1.1 Air temperature
1.2 Extremes of air temperature
-80-+60°C
-80-+60°C
0.1K
0.1K
I
I
0.3K for =-40°C
0.3K for =-40°C
0.3K for =-40°C
0.3K for =-40°C
20 s
20 s
1 min
1 min
0.2 K
0.2 K
Achievable uncertainty and effective time constant may be affected by the design of thermometer solar radiation screen. Time constant
depends on the airflow over the sensor.
2. Humidity
2.1 Dew-point
temperature
2.2 Relative humidity
-80-+35°C
0-100%
0.1K
1%
I
I
0.1K
1%
20 s
20 s
40 s
1
m in
1 min
1 min
0.5 K
0.2 K
3%
If measured directly and in combination with
air temperature (dry bulb). Large errors are
possible due to aspiration and cleanliness
problems.
Solid state sensors may show significant temperature and humidity dependence.
Wet-bulb temperature (psychrometer)
Solid state and others
3. Atmospheric pressure
3.1 Pressure
3.2 Tendency
500-1080 hPa
Not specified
0.1 hPa
0.1 hPa
I
I
0.1 hPa
0.2 hPa
20 s
1 min
0.3hPa
0.2hPa
Both station pressure and MSL pressure.
Measurements uncertainty seriously affected
by dynamic pressure due to wind if no precautions are taken. Inadequate temperature compensation of the transducer may affect the
measurement uncertainty significantly.
Difference between instantaneous values
Variable
Range
Reported
resolu-tion
Mode of
meas./o
bs.
Required measurement uncertainty
Sensor
time constant
Output
avera-ging
time
Achievable measurement
uncertainty
Remarks
4. Clouds
4.1 Clouds amount
4.2 Height of cloud base
0/8-8/8
0 m-30 km
1/8
10 m
I
I
1/8
10 m for≤100 m
10% for>100 m
n/a
n/a
2/8
~10 m
Period (30 s) clustering algorithms may be
used to estimate low cloud amount automatically.
Achievable measurement uncertainty undeterminated because no clear definition exists for
instrumentally measured cloud base height
(e.g. based on penetration depth or significant
discontinuity in the extinction profile).
Significant bias during precipitation.
5. Wind
5.1. Speed
5.2. Direction
5.3. Gusts
0-75 m s -1
0-360º
0.5 m s -1
1º
A
A
0.5 m s -1
for ≤ 5 m s -1
5º
Distance
constant 2-5
m
0 a nd/or
1 1 0 min
0.5 ms -1
Average over 2 and/or 10 minutes. Nonlinear devices. Care needed in design of
averaging process. Distance constant is
usually expressed as response length. Averages computed over Cartesian components (see WMO Guide 2008 Part III,
Chapter 2, section 2.6
Highest 3 s average should be recorded.
6.Precipitation
6.1 Amount (daily)
The larger of 5% or
0.1 mm
Quantity based on daily amounts. Measured uncertainty depends on aerodynamic
collection efficiency of gauges and evaporation losses in heated gauges.
6.2 Depth of snow
0-500 mm
0-25 m
0.1 mm
1 cm
T
A
0.1mm for ≤ 5mm
2% for >5 mm
0
c m for ≤ 5mm
5% for >20 cm
n/a
n /a
Average depth over an area representative
of the observing site
(continued)
G. Baranka et al.