

As W p /W s is calculated using Eq. (4.1), the red lines in Fig. 4.30 can be drawn so
as to pass through the average concentration E j,s and the average weight change W p /
W s . If an element is immobile during Andisol formation, its concentration is plotted
along this line. The theoretical E j,p can also be calculated using E j,s and W p /W s so
long as an element is immobile. If a parent tephra has higher E j,p than average, the
plot of E j,s will appear above the solid line, and if it has a lower E j,p , it will appear
below the solid line. If different E j,p values of elements are scaled similarly, the
slopes of their E j,s plots will also be similar as seen in Fig. 4.30.
Among 54 elements, at least 27 (Be, Al, Ti, Fe, Y, Zr, Nb, La, Ce, Pr, Nd, Sm, Eu,
Gd, Tb, Dy, Ho, Er, Tm, Yb, Lu, Hf, Ta, Tl, Pb, Th, and U) were enriched in the
Andisols, and the increase in these concentrations was related to total weight loss
owing to the soil formation processes. Of the major elements in soil, concentrations
of Si, Ca, and Na clearly decrease with the weight loss as shown in Fig. 4.30.
However, the slope of the decrease in the element concentration is steeper for Ca and
Na than for Si (Fig. 4.30). One possible reason is that Ca and Na are not the major
constituents of Andisol formation products, but Si is the main structural constituent
of allophane and imogolite. Other possible explanations are that Si can be sorbed by
ferrihydrite, and that Si is also partly retained in Andisols as opaline silica or
phytoliths. The weight-loss of tephra, maintaining the altermorphs (Figs. 4.26 and
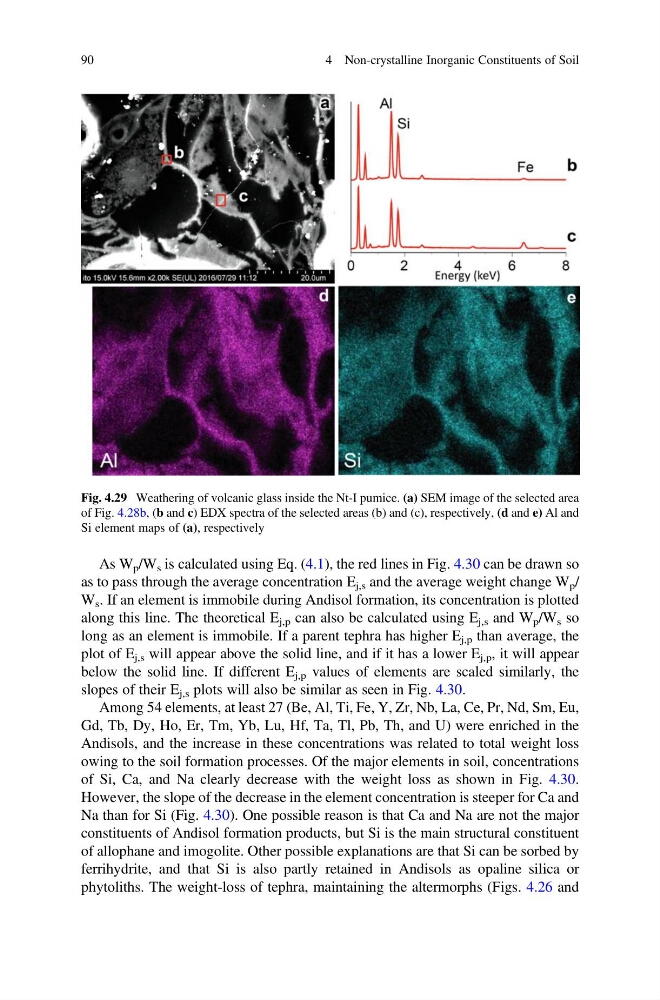
Fig. 4.29 Weathering of volcanic glass inside the Nt-I pumice. (a) SEM image of the selected area
of Fig. 4.28b, (b and c) EDX spectra of the selected areas (b) and (c), respectively, (d and e) Al and
Si element maps of (a), respectively
90
4 Non-crystalline Inorganic Constituents of Soil
as to pass through the average concentration E j,s and the average weight change W p /
W s . If an element is immobile during Andisol formation, its concentration is plotted
along this line. The theoretical E j,p can also be calculated using E j,s and W p /W s so
long as an element is immobile. If a parent tephra has higher E j,p than average, the
plot of E j,s will appear above the solid line, and if it has a lower E j,p , it will appear
below the solid line. If different E j,p values of elements are scaled similarly, the
slopes of their E j,s plots will also be similar as seen in Fig. 4.30.
Among 54 elements, at least 27 (Be, Al, Ti, Fe, Y, Zr, Nb, La, Ce, Pr, Nd, Sm, Eu,
Gd, Tb, Dy, Ho, Er, Tm, Yb, Lu, Hf, Ta, Tl, Pb, Th, and U) were enriched in the
Andisols, and the increase in these concentrations was related to total weight loss
owing to the soil formation processes. Of the major elements in soil, concentrations
of Si, Ca, and Na clearly decrease with the weight loss as shown in Fig. 4.30.
However, the slope of the decrease in the element concentration is steeper for Ca and
Na than for Si (Fig. 4.30). One possible reason is that Ca and Na are not the major
constituents of Andisol formation products, but Si is the main structural constituent
of allophane and imogolite. Other possible explanations are that Si can be sorbed by
ferrihydrite, and that Si is also partly retained in Andisols as opaline silica or
phytoliths. The weight-loss of tephra, maintaining the altermorphs (Figs. 4.26 and
Fig. 4.29 Weathering of volcanic glass inside the Nt-I pumice. (a) SEM image of the selected area
of Fig. 4.28b, (b and c) EDX spectra of the selected areas (b) and (c), respectively, (d and e) Al and
Si element maps of (a), respectively
90
4 Non-crystalline Inorganic Constituents of Soil